
Figures & data
Figure 1. ANP32e regulates cell proliferation of U2OS cells. (A) Protein levels of ANP32e were measured by Western blotting after 72 h incubation with no siRNA (WT), negative control siRNA (siNC), or one of two independent siRNAs targeting ANP32e (siANP32e-1 or siANP32e-2). Quantification is shown in the right panel (n = 3). Error bars represent SD. *p < 0.05. (B) mRNA levels of ANP32e and (C) H2A.Z were measured by RT-qPCR after 72 h incubation with siRNA (n = 3). Error bars represent SD. *p < 0.05. (D) Following siRNA treatment, cell proliferation was determined by counting total cell numbers on days 0, 2, 4, and 6 post-siRNA treatment (n = 3). *p < 0.05. (E) Confocal images of siRNA-treated, asynchronously growing cells stained with Phospho-Histone H3 (Ser10) Antibody, TUNEL, and DAPI. A representative image of each sample is shown. Scale bar = 50 µm. (F) Quantification of apoptotic cells as determined by TUNEL assay and DAPI staining followed by confocal imaging. DNase I-treated cells were used as a positive control (n = 3). Error bars represent SD. *p < 0.05. (G) Quantification of confocal images taken of siRNA-treated, asynchronously growing cells stained with Phospho-Histone H3 (Ser10) Antibody and DAPI. The total numbers of cells and mitotic cells were counted at 10× magnification in five fields of views per experiment (n = 3). Error bars represent SD. *p < 0.05.
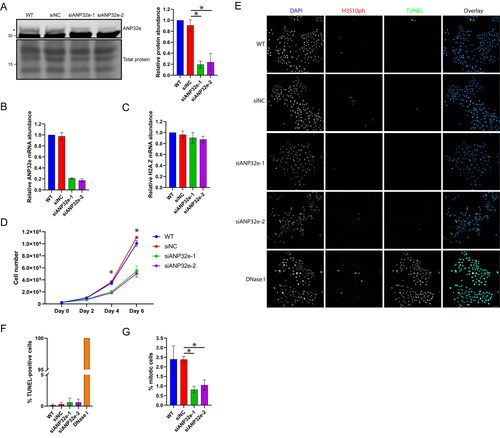
Figure 2. ANP32e preferentially interacts with H2A.Z during G1 phase of the cell cycle. (A) Western blot analysis of whole-cell lysates of cells not expressing Strep-tagged protein (WT) and cells expressing Strep–ANP32e identified with antibody against endogenous protein. The Pierce reversible total protein stain was used as a loading control. The top asterisk indicates Strep–ANP32e protein, and the bottom asterisk indicates endogenous ANP32e protein. (B) Volcano plot showing putative nucleoplasmic Strep–ANP32e interactants in G1 phase of the cell cycle, or (C) G2-M phase of the cell cycle. Statistical analysis was carried out with Perseus software. Proteins are shown in red dots if p < 0.05 and log2-fold difference > 1. (D) Volcano plot showing differential protein abundance (p < 0.05 and log2-fold difference > 1 or < −1) in Strep–ANP32e pulldowns in G1 phase (left) or G2-M phase (right) phase of the cell cycle. Proteins identified as putative Strep–ANP32e interactants in (B) and (C) are shown in red dots. Proteins identified as non-specific background in (B) and (C) but that did show differential protein abundance are shown in blue dots. (E) Strep–ANP32e was affinity purified from nuclear extract of cells synchronized in G1 or G2-M phase. The abundance of associated H2A.Z was measured by Western blotting. The abundance of H2A.Z and ANP32e protein was normalized to that of the total Strep-tagged protein. The right panel shows quantification of replicates (n = 3). Error bar represents SD. *p < 0.05. (F) As in (E), except Strep–H2A.Z was affinity purified, and the association of endogenous ANP32e and YL1 was measured (n = 3). Error bar represents SD. *p < 0.05. (G). As in (E), except Strep–H2A was affinity purified as a negative control. No ANP32e or YL1 was detected.
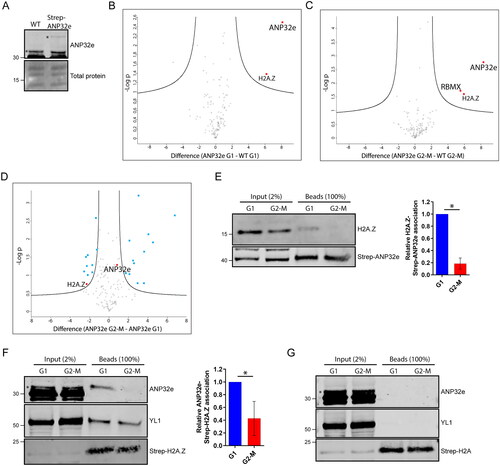
Figure 3. ANP32e does not remove H2A.Z from chromatin. (A) Cells were treated for 72 h with no siRNA (WT), negative control siRNA (siNC), or siRNAs targeting ANP32e (siANP32e-1 or siANP32e-2), and then synchronized in G1 or G2-M phase. Cells were fractionated, and the chromatin pellet fraction was analyzed by Western blotting to measure H2A.Z abundance. The Pierce total protein stain was used as a loading control. Quantification of H2A.Z signal normalized to total protein is shown on the right (n = 3). Error bars represent SD. (B) H2A.Z abundance at +1 nucleosomes at seven gene promoters was determined by ChIP-qPCR after siRNA treatment for 72 h (n = 3). Error bars represent SD. (C) Total numbers of peaks identified in ChIP-sequencing experiments of negative control (WT), Strep–ANP32e-associated DNA, Strep–YL1-associated DNA, or Strep–H2A.Z-associated DNA in cells synchronized in G1 or G2-M phase. Peak numbers indicate after the normalization to input.
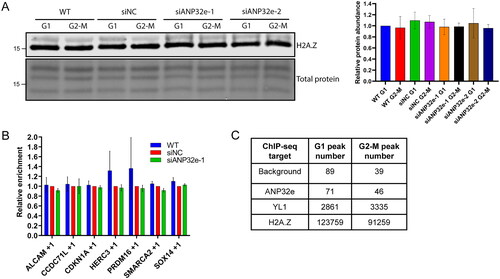
Figure 4. ANP32e interacts with H2A.Z in the cytoplasm in proportion to H2A.Z protein abundance. (A) Equal proportions of cytosolic (Cyt), nuclear (Nuc), and chromatin pellet (Chrom) fractions from cells synchronized in G1 or G2-M phase were analyzed by Western blotting to measure the abundance of YL1, GAPDH, ANP32e, and H2A.Z. The asterisk indicates the ANP32e band. (B) Strep–ANP32e was affinity purified from cytoplasmic extract of cells synchronized in G1 or G2-M phase. The abundance of associated H2A.Z was measured by Western blotting and normalized to that of the total Strep-tagged protein. The right panel shows quantification of replicates (n = 3). Error bar represents SD. *p < 0.05. (C) As in (B), except Strep–H2A.Z was affinity purified and the association of endogenous ANP32e and H2B was measured. The right panel shows the quantification (n = 3). Error bar represents SD. (D) The total abundance of ANP32e protein in the cytoplasm (left) and nucleoplasm (right) of cells synchronized in G1 or G2-M phase was quantified by Western blotting (shown in (A)) and normalized to total protein (n = 4). Error bar represents SD. (E) The total abundance of H2A.Z protein in the cytoplasm (left) and nucleoplasm (right) of cells synchronized in G1 or G2-M phase was quantified by Western blotting (shown in (A)) and normalized to total protein (n = 3). Error bar represents SD. *p < 0.05. (F) The total abundance of H2B protein in the cytoplasm of cells synchronized in G1 or G2-M phase was quantified by Western blotting (shown in (C)) and normalized to total protein (n = 4). Error bar represents SD.
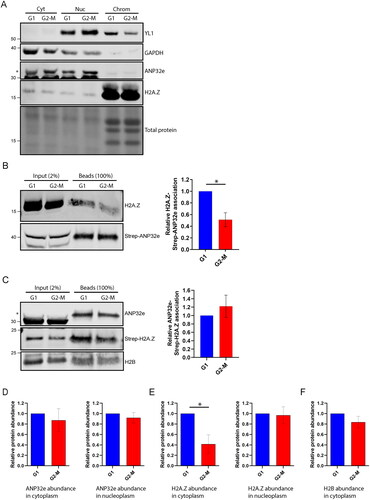
Figure 5. ANP32e regulates H2A.Z protein stability in the cytoplasm. (A) Cells were treated for 72 h with no siRNA (WT), negative control siRNA (siNC), or siRNA targeting ANP32e (siANP32e-1), and then synchronized in G1 or G2-M phase. Whole-cell lysates were analyzed by Western blotting for total H2A.Z protein. The Pierce total protein stain was used as a loading control. Quantification of H2A.Z signal normalized to total protein is shown on the right (n = 3). Error bars represent SD. (B) Cells were treated for 72 h with siRNA and synchronized in G1 or G2-M phase. Cells were fractionated and the nucleoplasmic fraction was analyzed by Western blotting to measure H2A.Z and ANP32e abundance. The Pierce total protein stain was used as a loading control. Quantification of H2A.Z signal normalized to total protein is shown on the right (n = 3). Error bars represent SD. (C) Cells were treated for 72 h with siRNA and synchronized in G1 or G2-M phase. Cells were fractionated, and the cytoplasmic fraction was analyzed by Western blotting for H2A.Z and ANP32e abundance. The Pierce total protein stain was used as a loading control. Quantification of H2A.Z signal normalized to total protein is shown on the right (n = 3). Error bars represent SD. *p < 0.05. (D) Cells expressing SNAP–H2A.Z were blocked treated for 48 h with siRNA. The SNAP-tag was blocked with SNAP-Cell Block to prevent fluorescence, and nascent SNAP–H2A.Z protein was produced for 48 h. The SNAP-tag was labeled with SNAP-Cell 647-SiR and imaged using confocal microscopy. DAPI was used to visualize nuclei. A representative image of each sample is shown. Scale bar = 20 µm. (E) Quantification of nascent nuclear SNAP–H2A.Z using images from (D). SNAP-tag fluorescence was quantified only in regions that were stained with DAPI (n = 3). Error bars represent SD. *p < 0.05.
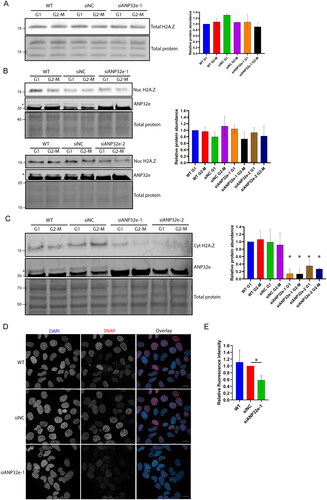
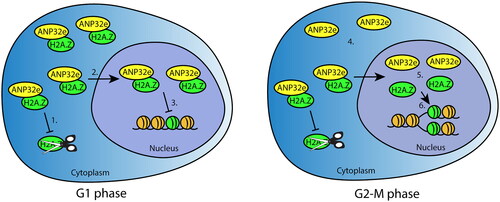
Figure 6. Model of ANP32e cell cycle functions related to H2A.Z. In G1 phase (left), ANP32e associates with H2A.Z in the cytoplasm and nucleoplasm. In the cytoplasm, ANP32e prevents the degradation of H2A.Z (1), which promotes its import into the nucleus (2). In the nucleus, ANP32e binding to H2A.Z prevents its incorporation into chromatin (3). In G2-M phase (right), the amount of H2A.Z protein associated with ANP32e in the cytoplasm is halved because of the decrease in the total abundance of H2A.Z protein (4). In the nucleus, the interaction between ANP32e and H2A.Z also decreases (5). However, this is not because of the decrease in the abundance of H2A.Z protein during G2-M. Release of H2A.Z from ANP32e allows the incorporation of H2A.Z into chromatin after DNA replication (6).
Supplemental Material
Download Zip (2 MB)Data availability statement
The mass spectrometry proteomics data have been deposited to the ProteomeXchange Consortium via the PRIDECitation53 partner repository with the dataset identifier PXD033229. The ChIP-sequencing data are available in the ArrayExpress database (http://www.ebi.ac.uk/arrayexpress) under accession number E-MTAB-11617.