
Figures & data
Figure 1. Percent of working-age (15–64-year-old) population in full-time or part-time study, 2018 Census. Geographic boundaries (SA2) at 1 January 2018. Extracted from (Stats New Zealand Citation2023a).
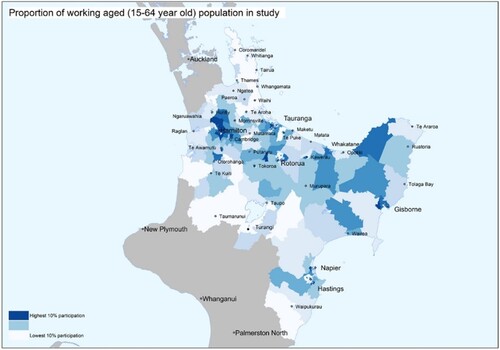
Figure 2. Working age (15–64-year-old) population, Waikato, Bay of Plenty–Waiariki, Hawke's Bay-Tairāwhiti regions, 2012–2022. Source: Statistics New Zealand, Subnational population estimates (RC, SA2), by age and sex, at 30 June 1996–2022. Extracted from NZ.Stat (Stats New Zealand Citation2023a).
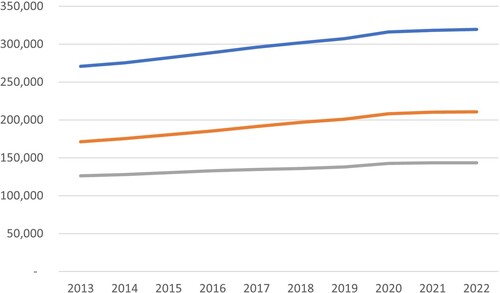
Figure 3. School leavers by year, Waikato, Bay of Plenty–Waiariki, Hawke's Bay-Tairāwhiti regions, 2012–2022. Source: Ministry of Education, Time Series Data: School Leavers with Highest Attainment (2013–2023) (Education Counts Citation2023b)
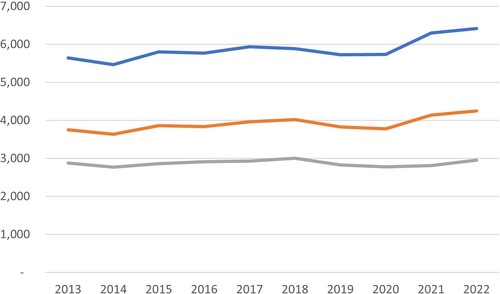
Figure 4. Tertiary student enrolments (headcount) by subsector, Waikato, Bay of Plenty – Waiariki and Hawke's Bay – Tairāwhiti regions and national (total New Zealand), 2012–2022. Students are counted in each sub-sector they enroll in, so the sum of the various sub-sectors may not add to the total. Study region is based on the delivery site of the courses that intramural students were enrolled in or the location of employment for industry training (ITO) learners. Students are counted in each region they enroll in, so the sum of the various regions may not add to the total. Source: Ministry of Education Provider based enrolment data (Education Counts Citation2023c); Ministry of Education Participation in industry training data (Education Counts Citation2023a).
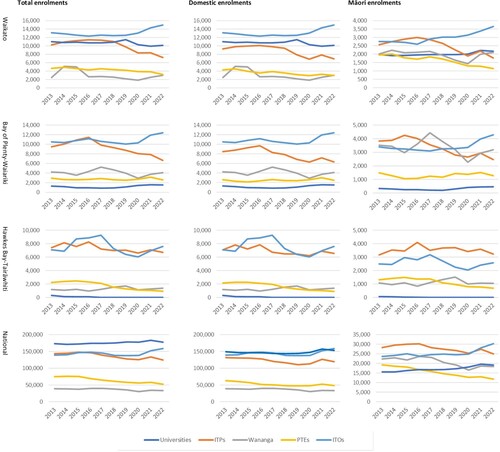
Table 1. Wintec regional campus enrolments (headcount), 2003–2020.
Table 2. Toi Ohomai regional campus enrolments (headcount), 2014–2020.
Table 3. EIT regional campus enrolments (headcount), 2005–2020.
Table 4. Waiariki – Toi Ohomai Rotorua headcount enrolments by student type, 2008–2020.

