
Figures & data
Figure 1. Relationship between clinical stage, OS and immune matrix score. (A) The immune scores of TCGA samples were significantly correlated with the OS of patients with LUAD. (B) Stromal scores of TCGA samples. (C) The immune scores of high-stage groups were significantly lower than those of the low-stage groups. (D) Sromal scores in different stage groups.
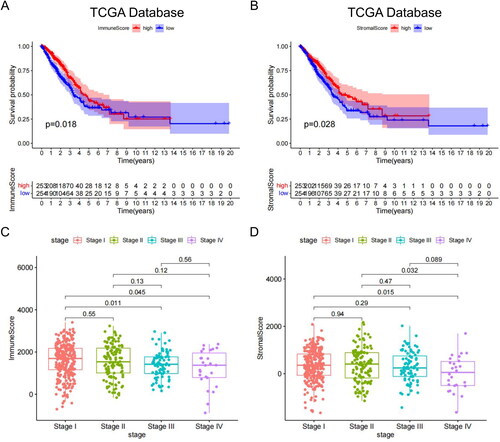
Figure 2. SMC abundance correlation analysis. (A) SMC was significantly correlated with stromal scores. (B) SMC was significantly correlated with immune scores. (C) SMC abundance significantly decreased as tumour stage increased. (D) Differentially expressed genes between groups with high- and low-SMC content. (E) Sample-level clustering. (F) A scale-free network was constructed with β = 5 (scale-free R2 = 0.9). (G) Mean connectivity of network result. (H) A topological overlap matrix was used to identify co-expression modules; the blue-green module was most significantly correlated with SMC abundance.

Figure 3. Differentially expressed genes and survival in LUAD patients. (A) Differentially expressed genes (DEGs, n = 32), with upregulated genes in red and downregulated genes in green. (B) Upregulated genes were significantly associated with prognosis in the TCGA-LUAD cohort. (C) Kaplan–Meier survival analysis showed that the high-risk group had a shorter survival time than the low-risk group (D) Univariate independent prognostic analyses. (E) Multivariate independent prognostic analyses. (F) The ROC curve was constructed based on the SMC risk model for LUAD diagnosis. (G) OS predictions for patients with LUAD at one, three, and five years. (H) Predicted OS values for patients were consistent with actual values.
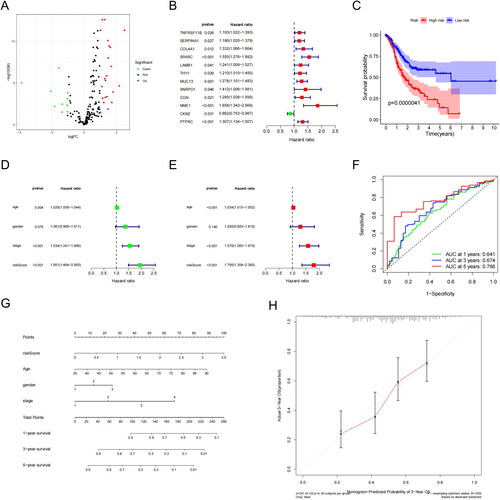
Figure 4. SPARC highly expressed in SMCs. (A) The heatmap of principal component analysis identifying feature genes in each principal component, followed by gene expression analysis in samples. (B) Top 20 gene expression in each principal component. (C) The heatmap of marker genes in clusters. (D) UMAP visualization revealed four major cell subgroups: macrophages, epithelial cells, endothelial cells, and smooth muscle cells. (E) Cluster plot for the four cell groups. (F) Cell developmental trajectories and cell trajectory times for the groups. (G) Cell types plot for the groups (H) Bubble chart for the four SMC genes associated with prognosis, with SPARC highly expressed in SMCs. (I) Scatter plot of four SMC genes.
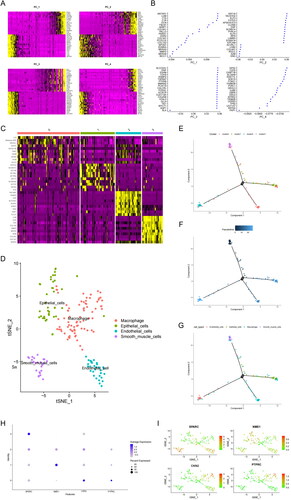
Figure 5. The role of SPARC in LUAD and CD276 immune checkpoint. (A) SPARC was expressed at low levels in LUAD. (B) Survival analysis: SPARC expression was significantly correlated with OS in patients with LUAD. (C) Clinical correlation analysis: SPARC was negatively correlated with LUAD tumour stage. (D) Sixty-two immune cells were differentially expressed between the two risk groups (high SPARC expression versus low SPARC expression). (E) Box plots of immune pathway analysis showing 13 pathways that differed significantly between the two groups. (F) Box plot analysis of DEGs. The CD276 immune checkpoint showed low infiltrating levels in the high-risk group. All original data are from TCGA data. All panels are SPARC mRNA expression.
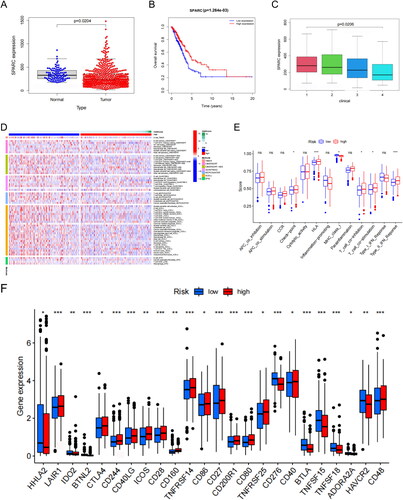
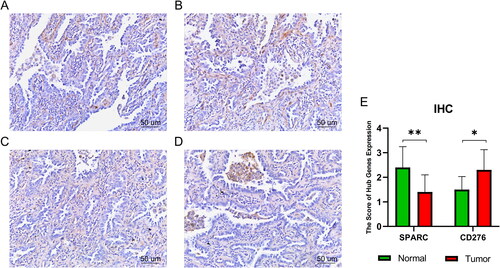
Figure 6. Immunohistochemistry results. (A)SPARC:IHC staining of normal lung tissue. (B) SPARC:IHC staining of tumour lung tissue. (C) CD276:IHC staining of normal lung tissue. (D) CD276:IHC staining of tumour lung tissue. (E) Quantitation of hub gene expression at the level of protein. *p < .05; **p < .01. Scale bars = 50 µm; 400× magnification (CX43, Olympus, Tokyo, Japan).
Supplemental Material
Download MS Word (1.8 MB)Data availability statement
Anonymized data will be made available from the corresponding author [YY] upon reasonable request.