
Figures & data
Figure 1. Flowchart describing the proposed method.
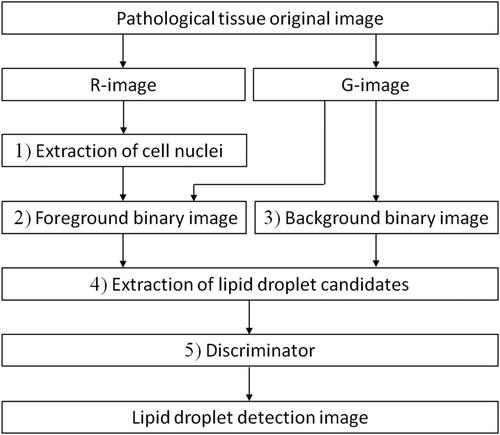
Figure 2. Weights of an error diffusion filter (*target pixel).
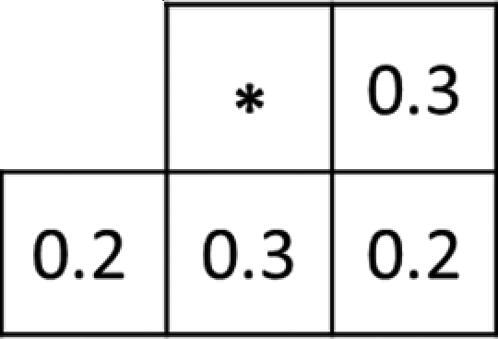
Figure 5. ‘AND’ image (logical product between two images) of each rank: rank 6 (a), rank 5 (b), rank 4 (c) and rank 3 (d) [scale bar: 100 μm]. *A different version of the image in is displayed.
![Figure 5. ‘AND’ image (logical product between two images) of each rank: rank 6 (a), rank 5 (b), rank 4 (c) and rank 3 (d) [scale bar: 100 μm]. *A different version of the image in Figure 3(a) is displayed.](/cms/asset/eef4e88f-2424-4543-8be5-9f27af8068bd/tbeq_a_2338433_f0005_b.jpg)
Figure 6. Environment: numbers indicate indexes, circle indicates an agent, and arrow indicates movement direction.
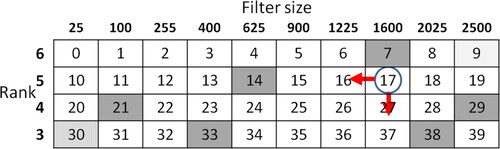
Figure 7. Definition of reward: overlapping region/newly extracted region.
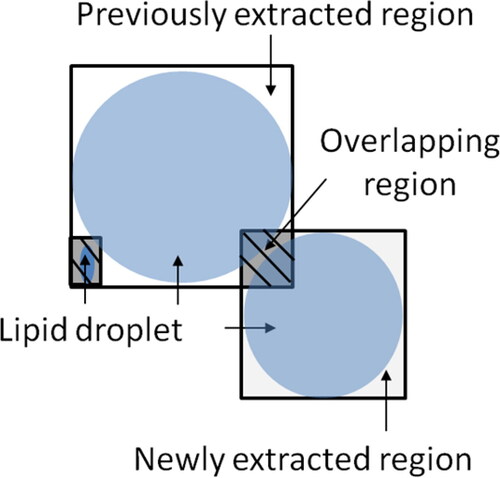
Figure 8. Episodes and average Q values.
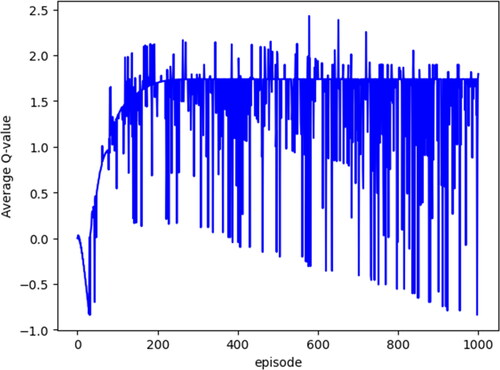
Figure 3. Original image 1/6 (a) and cell nucleus image (b) [scale bar: 100 μm]. *1/6 of the original image in is displayed.
![Figure 3. Original image 1/6 (a) and cell nucleus image (b) [scale bar: 100 μm]. *1/6 of the original image in Figure 3(a) is displayed.](/cms/asset/d5d9a44b-dbdc-4368-b31e-89be04f45fdd/tbeq_a_2338433_f0003_c.jpg)
Figure 4. Foreground binary image of each rank: rank 6 (a), rank 5 (b), rank 4 (c), and rank 3 (d).[scale bar: 100 μm]. *A different version of the image in in is displayed. Four types of foreground binary images were created, each corresponding to a specific rank (6, 5, 4 and 3) as a threshold. The figure illustrates the foreground binary images for each rank in the original image (1/6 area).
![Figure 4. Foreground binary image of each rank: rank 6 (a), rank 5 (b), rank 4 (c), and rank 3 (d).[scale bar: 100 μm]. *A different version of the image in in Figure 3(a) is displayed. Four types of foreground binary images were created, each corresponding to a specific rank (6, 5, 4 and 3) as a threshold. The figure illustrates the foreground binary images for each rank in the original image (1/6 area).](/cms/asset/8ce3c166-2b7d-4283-bddd-e5da2a534190/tbeq_a_2338433_f0004_b.jpg)
Figure 9. Each rank image with noise removed: rank 6 (a), rank 5 (b), rank 4 (c) and rank 3 (d). [scale bar: 100 μm]. *A different version of the image in is displayed.
![Figure 9. Each rank image with noise removed: rank 6 (a), rank 5 (b), rank 4 (c) and rank 3 (d). [scale bar: 100 μm]. *A different version of the image in Figure 3(a) is displayed.](/cms/asset/f1de810e-c745-4569-876d-f599e91e6214/tbeq_a_2338433_f0009_b.jpg)
Figure 10. Lipid droplet detection image: each rank (a)–(d) and overall (e) [scale bar: 100 μm]. *A different version of the image in is displayed.
![Figure 10. Lipid droplet detection image: each rank (a)–(d) and overall (e) [scale bar: 100 μm]. *A different version of the image in Figure 3(a) is displayed.](/cms/asset/85fae1eb-1f45-4232-991f-7819eba374c9/tbeq_a_2338433_f0010_c.jpg)
Table 1. Classifier comparison.
Table 2. Effect of dimensionality reduction.
Figure 11. Scatter plot matrix.
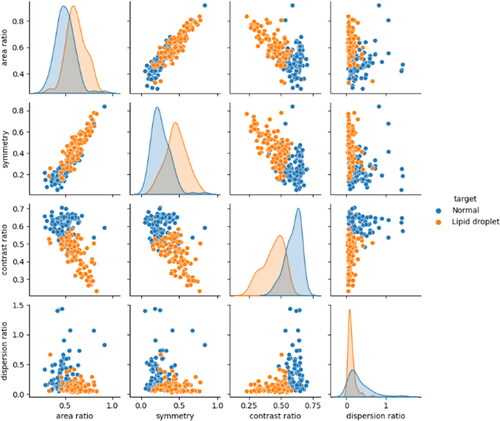
Table 3. Correct answer rate for two lipid droplet images [%].
Figure 12. Original image 1/6 (a) and lipid droplet detection image (b). [scale bar: 100 μm]. *A different version of the image in is displayed. The detection performance was relatively effective for large lipid droplets, but smaller lipid droplets were identified with lower accuracy, resulting in detection gaps. The execution time for this method averaged approximately 16 min and 30 s per image using Google Colaboratory-1.0.0.
![Figure 12. Original image 1/6 (a) and lipid droplet detection image (b). [scale bar: 100 μm]. *A different version of the image in Figure 3(a) is displayed. The detection performance was relatively effective for large lipid droplets, but smaller lipid droplets were identified with lower accuracy, resulting in detection gaps. The execution time for this method averaged approximately 16 min and 30 s per image using Google Colaboratory-1.0.0.](/cms/asset/01e497ca-9228-46d8-a831-c67694d87013/tbeq_a_2338433_f0012_c.jpg)
Data availability statement
The data supporting the findings reported herein are available from the corresponding author, HN, upon reasonable request.