Figures & data
Figure 1. Starch content and starch synthesis-related gene expressions in the leaf sheathes of six rice cultivars. (a) The starch content and starch synthesis-related gene expressions at various developmental stages. Rice leaf sheathes were sampled in the evening of vegetative stage (VGS, 8.5 leaf stage) and reproductive stages of 0, 10 and 20 days after heading (DAH). The expressions of starch synthesis related genes relative to Actin analyzed by qRT-PCR are shown. Data represent mean ± SD of four to five biological replicates. (b) The correlation between starch content and starch synthesis-related gene expressions as a function of CRCT expression. Data were obtained from the experiment of .
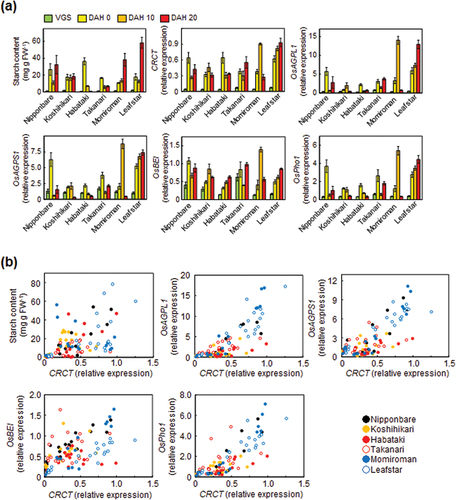
Table 1. Slopes of the liner regressions and its correlation coefficients of the relationship between the expressions of CRCT and starch synthesis related genes in leaf sheathes during development.
Figure 2. Effects of sucrose on the expression of starch synthesis-related genes in the leaf blades of the six rice cultivars. Seventh leaf blades at 7.2 leaf stage were immersed in water (H2O) or 50 mM sucrose solution (Suc). The expressions of CRCT and starch synthesis-related genes (OsAGPL1, OsAGPS1, OsBEI, and OsPho1) relative to Actin analysed by qRT-PCR are shown. The data represents the means ±SD of four independent samples. Asterisks indicate significant differences between a water-treated group and a sucrose-treated group for the same hour and cultivar by the Student’s t-test (*p < 0.05).
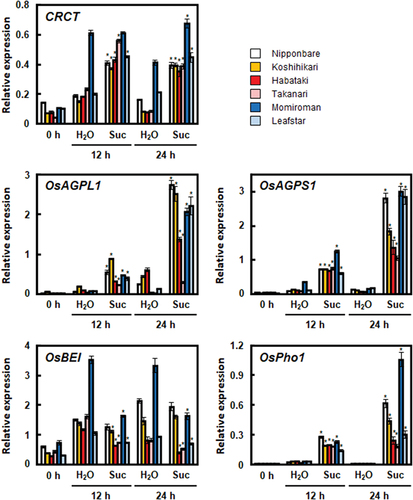
Table 2. Slopes of the linear regressions and its correlation coefficients of the relationship between the expressions of CRCT and starch synthesis related genes in leaf blades after sucrose treatment.
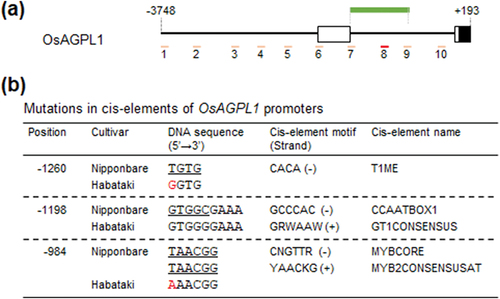
Figure 3. Comparison of nucleotide sequence of OsAGPL1 promoters. (a) Diagram of OsAGPL1 promoter in Nipponbare. Amplified positions in previous ChIP-qPCR analysis (Fukayama et al., Citation2021) are shown in pink and red bar. Especially, the position enriched by ChIP are shown in red bar. The position amplified by PCR for sequence analysis are shown in green bar. (b) Mutations in cis-elements of OsAGPL1 promoters among six cultivars. Cis-elements which have nucleotide mutations compared to Nipponbare are listed, and mutated nucleotide is coloured in red. The nucleotide sequences of cis-elements are underlined. Position is based on the numbers from the translation initiation site.