Figures & data
Table 1. LOBSTER labels of order book events.
Table 2. Mapping of LOBSTER labels to event types.
Table 3. Ten time stamps from the filtered message file and order book file.
Table 4. Transition probabilities calibrated on INTC as of 25 January 2019.
Table 5. Hawkes parameters ,
, and
calibrated on INTC as of 25 January 2019.
Figure 1. Goodness-of-fit diagnostics for the model calibrated on INTC as of 25 January 2019. We test that the time-changed inter-arrival times of Equation (Equation4(4)
(4) ) are i.i.d. samples from a unit rate exponential distribution. Empirical quantiles of the time-changed inter-arrival times on the y-axis and theoretical quantiles of unit-rate exponential distribution on the x-axis.
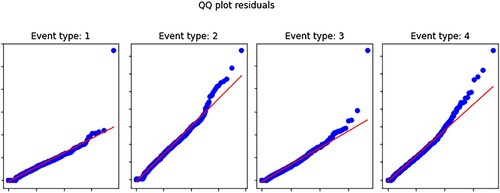
Figure 2. Mid-price trajectories on two time scales. Origin of time is set at 9.55am 25 January 2019. Time is measured in seconds. Prices are in USD.
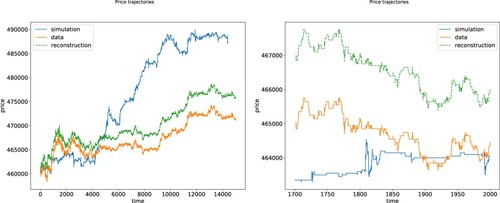
Table 6. Parameters of the liquidation schedule.
Figure 3. Price impact with low rate of walking the book and no clustering. Initial inventory , base rate
, clustering rate a = 0, order size c = 0.075, start time
, termination time
, and price impact score is 0.0346.
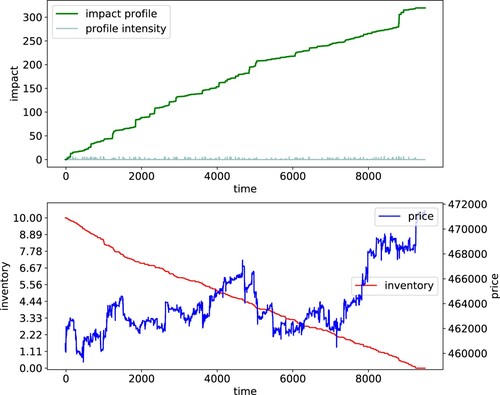
Figure 4. Simulated trajectories of the intensity of the price impact profile, i.e., the map (see Definition 5.8) for the scenario considered in Figure . The black solid line is the median trajectory of the impact profile across simulations and the red dotted lines are the 25% and 75% quantile trajectories.
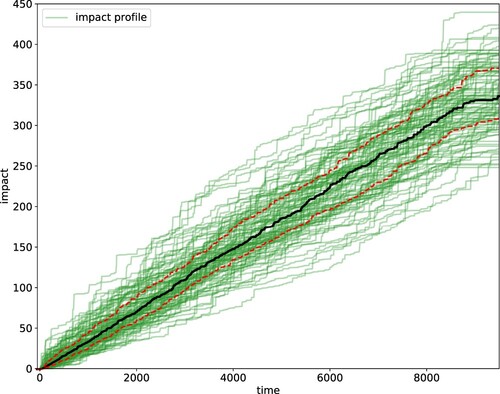
Figure 5. Left panel: box plots of the distribution of when stressing the order size parameter c. Right panel: box plots of the distribution of the price impact score as a function of the base rate
.
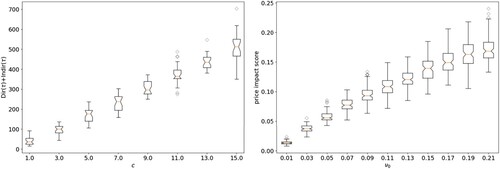
Figure 6. Price impact with high rate of walking the book and no clustering. Initial inventory , base rate
, clustering rate a = 0, order size c = 0.5, start time
, termination time
, and price impact score is 0.0426.
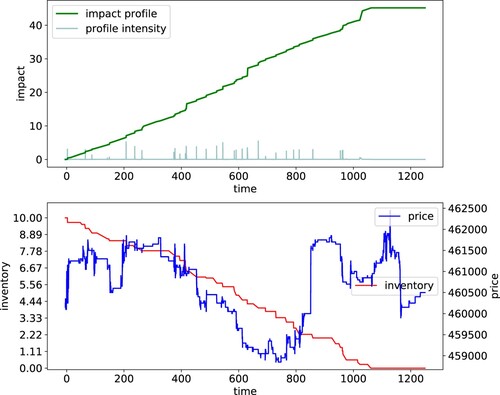
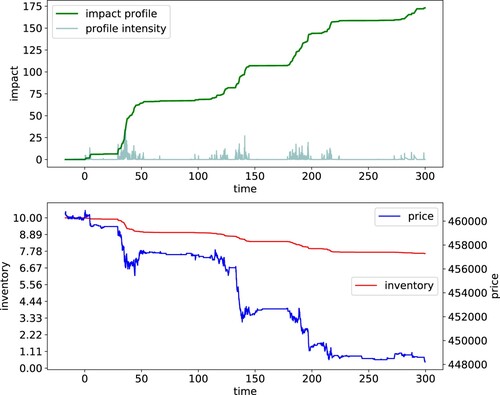
Figure 7. Price impact with clustering of liquidator's orders and low rate of walking the book. We show the first 300 s. Initial inventory , base rate
, clustering rate a = 0.25, order size c = 0.015, start time
, termination time
, and price impact score is 0.999.