Figures & data
Figure 1. Cell type-specific differential gene expression of SH-SY5Y and AC16 cells in response to HS- and thapsigargin-induced ER stress. (A) Immortalized neuronal SH-SY5Y and cardiac AC16 cells were exposed to HS (42 °C, 110 min) or thapsigargin (Tg) (500 nM, 16 h). RNA was subsequently isolated from each sample and RNAseq was performed. Two technical replicates were used for each condition. (B) Number of differentially expressed genes (DEGs) relative to naïve (i.e. untreated cells) in each condition for SH-SY5Y and AC16 cells exposed to HS (left) or thapsigargin (right). Blue bars denote number of genes downregulated; red bars represent number of genes upregulated. FDR < 0.05. (C) Differentially expressed genes in SH-SY5Y (left) and AC16 (right) cells exposed to HS. Each dot represents a single gene, red dots depict significantly upregulated genes and blue dots depict significantly downregulated genes. Grey dots depict genes that are not significantly changing. FDR < 0.05. (D) Top upregulated genes in SH-SY5Y and AC16 cells upon exposure to heat shock. Yellow dots represent genes that are upregulated; blue dots represent genes that are downregulated. Size of dot denotes size of logFC. Color gradient represents adjusted p value; yellow dots denote adjusted p value < 0.05. Gene ontology, reactome and hallmark pathways represented in genes differentially expressed in SH-SY5Y (E) and AC16 (F) cells post-HS. (G) Differentially expressed genes in SH-SY5Y (left) and AC16 (right) cells exposed to thapsigargin. Red dots represent upregulated genes, blue dots represent downregulated genes and grey dots represent unchanging genes. FDR < 0.05. (H) Top differentially expressed genes in SH-SY5Y and AC16 cells exposed to thapsigargin. Yellow represents upregulated genes; blue represents downregulated genes. Size of dot indicates magnitude of logFC. Color gradient represents adjusted p value; yellow dots denote adjusted p value < 0.05. Published and curated gene sets represented in differentially expressed genes in SH-SY5Y (I) and AC16 (J) cells exposed to thapsigargin. Blue bars depict pathways represented in downregulated genes; red bars depict those represented in upregulated genes.
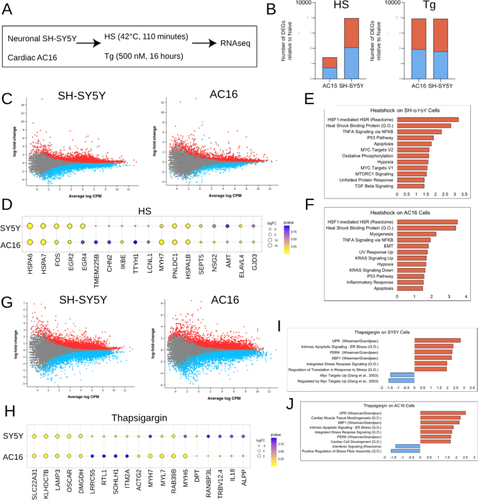
Figure 2. AC16 and SH-SY5Y cells exposed to amyloidogenic proteins exhibit robust cell type- and protein-specific gene expression changes. (A) SH-SY5Y and AC16 cells were exposed to bacterial-derived recombinant human TTR (wild-type, highly destabilized TTRL55P, cardiomyopathy-associated TTRV122I) and LC (germline LC and destabilized ALLC) variants at physiologically relevant concentrations for 48 h. To control for gene expression changes related to misfolded forms of TTRs, in parallel, TTRs were pre-incubated with kinetic stabilized tafamidis at appropriate stoichiometric ratios. RNA was isolated from each condition for RNAseq. Two technical replicates were used for each condition. (B) Number of differentially expressed genes (DEGs) relative to naïve (i.e. untreated cells) in each condition for SH-SY5Y (left) and AC16 (right) cells. Blue bars denote number of genes downregulated; red bars represent number of genes upregulated. FDR < 0.05. Top 15 significantly up- and downregulated genes seen in SH-SY5Y (C) and AC16 (D) cells exposed to TTRs, LCs, HS and thapsigargin. Each individual heatmap depicts the top 30 differentially expressed genes for cardiomyopathy-associated TTRV122I (left), highly destabilized TTRL55P (middle) or destabilized LC. Fold-changes are determined relative to naïve (i.e. untreated cells). Stimuli are depicted on the x-axis, differentially expressed genes on the y-axis. Samples are arranged via hierarchical clustering. FDR < 0.05.
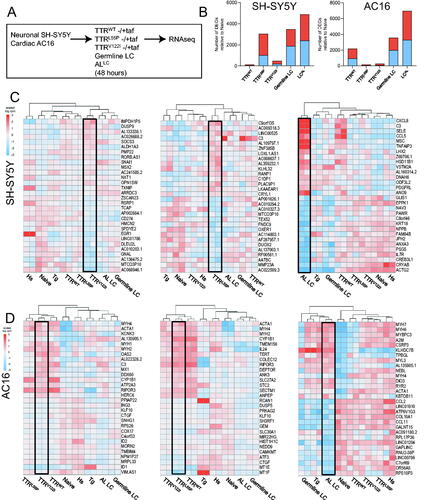
Table 1. Top 10 up- and top 10 downregulated genes in neuronal SH-SY5Y cells exposed to HS, thapsigargin or destabilized proteins.
Table 2. Top 10 up- and top 10 downregulated genes in cardiac AC16 cells exposed to HS, thapsigargin or destabilized proteins.
Figure 3. Cells exposed to destabilized TTR and LC exhibit gene expression changes distinct and shared with those subjected to HS- and thapsigargin-induced ER stress. (A–C) Differentially expressed genes shared between SH-SY5Y cells exposed to HS, thapsigargin, cardiomyopathy-associated TTRV122I, highly destabilized TTRL55P, as well as wild-type and destabilized LC (ALLC). for each comparison, the top 10 DEGs up- and downregulated in common to all comparisons are listed below. (D–F) DEGs shared across AC16 cells exposed to HS, thapsigargin, TTRV122I, TTRL55P, and germline and AL LCs. Top 10 DEGs in common to all conditions are listed below. Differentially expressed genes broken down by TTR variant in exposed AC16 (G) and SH-SY5Y (H) cells. Top 5 upregulated genes specific to TTRV122I (G) and TTRL55P (H) are noted.
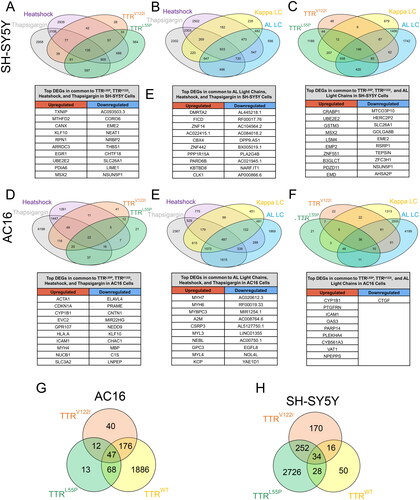
Figure 4. SH-SY5Y and AC16 cells exposed to HS and thapsigargin exhibit changes in chromatin accessibility signatures in cell type- and stress-specific manners. (A) SH-SY5Y and AC16 cells were exposed to HS (42 °C, 110 min) or thapsigargin (500 nM, 16 h). (B) Percentage of total DAPs in AC16 cells exposed to HS or thapsigargin located within promoter regions, intergenic regions, intronic regions or other non-coding regions of the genome. (C) Number of differentially accessible peaks (DAPs) in SH-SY5Y and AC16 cells exposed to HS and thapsigargin (Tg), left and right, respectively. DAPs are relative to naïve (i.e. untreated cells). DAPs included in calculation represent those associated with the promoter regions of known protein coding genes as defined by distance to the transcriptional start site. FDR < 0.05. Red represents DAPs which increase in abundance post-stress, while blue represents DAPs which decrease post-stress. (D) Significant DAPs in SH-SY5Y (left) and AC16 (right) cells exposed to heat shock. Red dots depict DAPs that increase in abundance; blue denotes DAPs that decrease in abundance. Fold-change relative to naïve condition. FDR < 0.05. (E) Top DAPs associated with promoter regions whose accessibility changes in SH-SY5Y and AC16 cells exposed to HS. Size of dot represents strength of fold-change. Color gradient represents adjusted p value. (F) Transcription factor binding sites associated with DAPs in promoter regions post-HS in SH-SY5Y (top) and AC16 (bottom) cells. Red bars depict transcription factor targets enriched in DAPs becoming more accessible post-HS while blue bars represent pathways enriched in DAPs becoming less accessible post-HS. (G) Total number of promoter region-associated DAPs differentially accessible in SH-SY5Y (left) and AC16 (right) cells post-thapsigargin exposure. Red and blue dots depict increasing and decreasing DAPs relative to naïve cells, respectively. FDR < 0.05. (H) Top changing promoter-associated DAPs in SH-SY5Y and AC16 cells exposed to thapsigargin. (I) Transcription factor binding sites associated with DAPs in promoter regions post-thapsigargin exposure in SH-SY5Y (top) and AC16 (bottom) cells.
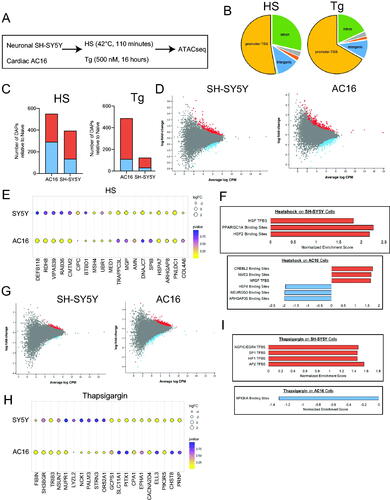
Table 3. Top 10 up- and top 10 downregulated DAPs in AC16 and SH-SY5Y cells exposed to HS and thapsigargin.
Table 4. Top 10 up- and top 10 downregulated DAPs in AC16 cells exposed to TTRWT and mutant TTRs.
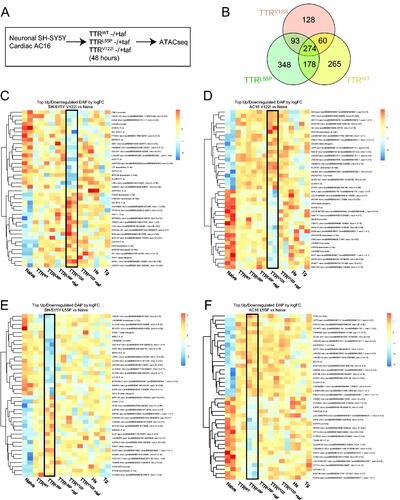
Figure 5. Cells exposed to pathologically associated destabilized TTR exhibit mutation-specific changes in chromatin signatures resolved by pre-incubation with tafamidis. (A) SH-SY5Y and AC16 cells were exposed to TTRWT, highly destabilized TTRL55P and cardiomyopathy-associated TTRV122I at physiological concentrations (0.2 mg/mL). Forty-eight hours later, gDNA was isolated and ATACseq was performed. In parallel, recombinant proteins were pre-incubated with tafamidis (taf) to control for changes due to misfolded forms of the protein. (B) Comparison of promoter region-associated DAPs unique to and shared between AC16 cells exposed to wild-type (TTRWT), cardiomyopathy-associated (TTRV122I) or highly destabilized (TTRL55P) TTR variants. DAPs noted are those relative to naïve condition. Heatmaps depicting top 20 up- and downregulated DAPs for SH-SY5Y and AC16 cells exposed to cardiomyopathy-associated TTRV122I (C, D) and highly destabilized TTRL55P (E, F) in the absence of tafamidis. On the y-axis are DAPs occurring in promoter regions associated with protein coding genes for each noted variant relative to naïve condition. HS- and Tg-exposed samples (noted in ) are also included. The x-axis notes samples in technical duplicate. Black boxes depict DAP signature resulting from noted variant.