
Figures & data
Figure 1. Amyloid in the annular ligament. Amyloid in the annular ligament (A-cross sectional area) was found as band like-deposits immediately below the surface (B–E; serial sections), as well as dot-like or patchy deposits within the matrix (F–H; serial sections). The band-like deposits at the surface were immunonegative for transthyretin (D) and immunoreacted with an antibody directed against fibrinogen (E). The dot-like and patchy deposits within the matrix stained for transthyretin (H). In 13 cases, both transthyretin- and fibrinogen-immunoreactive amyloid deposits were present within the same resection specimen (I–L; serial sections). Haematoxylin and eosin (A, B), Congo red in polarised light (C), Congo red in fluorescence microscopy (F, I), anti-transthyretin antibody (D, H, K), anti-fibrinogen antibody (E, L), anti-amyloid P component (J). Original magnifications 2-fold (A), 100-fold (I-L), 200-fold (F–H), and 400-fold (B–E).
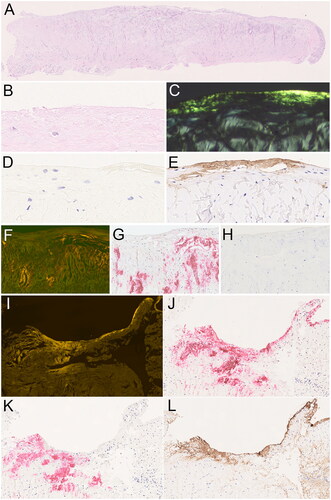
Table 1. Histoanatomical distribution of two different types of amyloid in resection specimens obtained during treatment of trigger finger.
Figure 2. Correlation of amyloid type with patient demographics. Percentages of amyloid types at different age groups at diagnosis in years. Ages grouped into 25–49 years, 50–74 years, and ≥75 years.
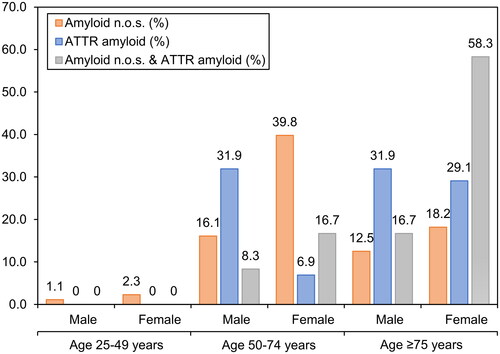
Figure 3. Identification of amyloid associated proteins by correlation of label-free intensity profiles. The scope of the datasets, when filtered for a minimum number of quantitative LFI values per protein among 12 TTR-positive samples (A) and 32 TTR − negative samples (B) is shown on the left axes. The right axes show the corresponding number of proteins with log2 LFI profiles significantly correlating with the average profile of three general amyloid signature proteins (APOE, SAMP and VTN, in black). Correlation-based assignment of TTR in ATTR amyloid (C) and FGA in the unknown amyloid (D). The Pearson’s correlation coefficient of log2 label-free intensity values profiles was tested against the average profile of three general amyloid associated proteins (shown in black). The protein abundance is displayed in relative label-free intensity values (rLFI).
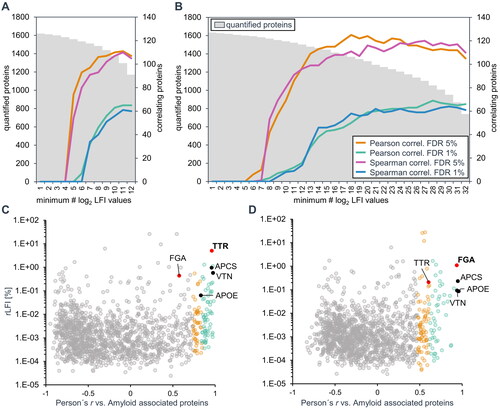
Figure 4. Amyloid quantification by proteomics and histology. The relative abundance of known potentially amyloidogenic proteins in each of the analysed cases is shown in (A) and (B). For amyloid n.o.s. cases, relative label-free intensity values of the two major amyloidogenic proteins, TTR, FGA, or the sum of both, were considered if a very strong correlation (r ≥ 0.8) with the amyloid signature profile was observed (C). These rLFI data were compared to the results of amyloid quantification by Congo red spectral shift assay (D). The comparison between the results of two analysis methods is shown in (E). The conformity of values achieved by both methods is shown by the bland altman plot (F).
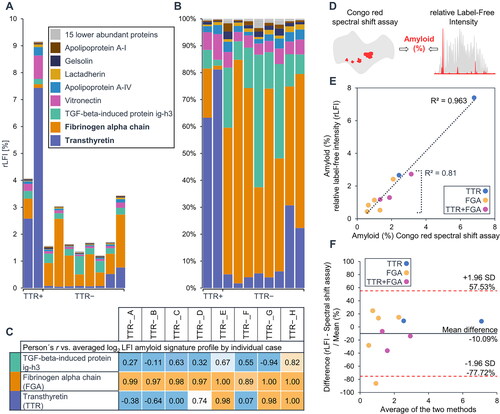
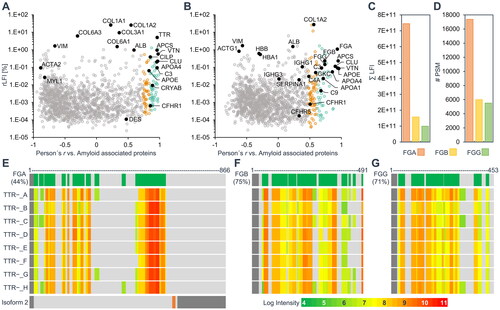
Figure 5. Amyloid associated proteins previously detected in ATTR or AFib amyloidosis in different tissues. The scatter plots show relative label-free intensities and Pearson correlation coefficients of log2 label-free intensity profiles against the average profile of three general amyloid associated proteins for the two datasets of ATTR amyloidosis cases (A) and the unknown amyloid (B). The 22 proteins previously detected in microdissected ATTR amyloid deposits from kidney, heart or synovial tissue are labelled and shown as black dots in (a). Only renal AFib amyloidosis cases were previously analysed by proteomics. The 25 previously detected AFib associated proteins are labelled and emphasised as black dots in (B). The sum intensity and number of peptide spectrum matches of fibrinogen alpha (FGA), beta (FGB), and gamma (FGG) chains are shown in (C) and (D), respectively. (E-G) show the total sequence coverage of fibrinogen proteins (green) on top, the signal peptides are indicated in dark grey. The relative log intensities of identified peptides for each case are illustrated below. Two isoforms of FGA are expressed by alternative splicing (E bottom). The second isoform differs in amino acids 631-644 (orange) and is truncated from amino acid 654 to 866 (dark gray), however, no peptide discerning the two isoforms could be identified.
Supplemental Material
Download MS Excel (2.2 MB)Supplemental Material
Download PDF (874.7 KB)Data availability statement
Anonymized data are available on request from the senior author.