
Figures & data
Figure 1. Flowchart showing the procedure and results of the literature search in accordance with the preferred reporting items for systematic reviews and meta-analysis (PRISMA) guidelines.
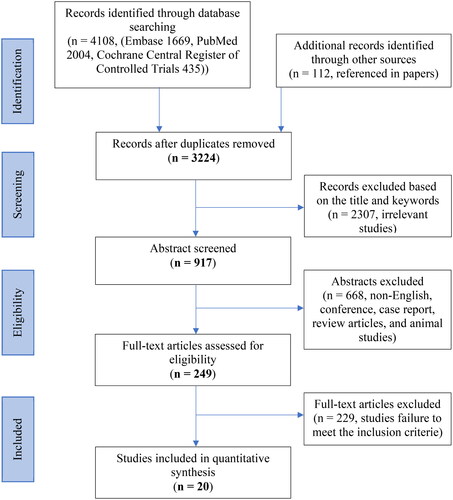
Table 1. Demographic information, list of inflammatory markers and clinical outcomes of the cohort studies included for meta-analysis.
Table 2. Demographic information, list of inflammatory markers and clinical outcomes of the treatment studies included for meta-analysis.
Figure 2. Assessment of the methodological quality of randomized controlled trials according to the Cochrane collaboration’s tool for assessing risk of bias.
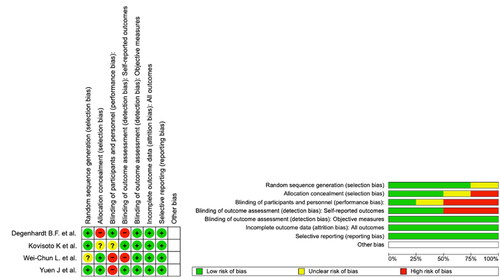
Table 3. Assessment Of the methodological quality of observational studies according to the Newcastle-Ottawa scale (NOS).
Figure 3. (A–E) Pre- and post-treatment back pain scores in visual analogue scale 10 cm (VAS 10 cm), visual analogue scale 100 mm (VAS 100 mm), numerical rating scale (NRS) and brief pain inventory short form were reported as the mean score and standard deviations (SD), and represented in , respectively. Forest plot of back pain score changes in different scales following treatments were reported as standardized mean difference (SMD) and 95% confidence intervals (CI). Sensitivity analysis based on the type of pain scale used was performed. Four methods were used to measure pain, VAS (10 cm), VAS (100 mm), NRS and the brief pain inventory short form.
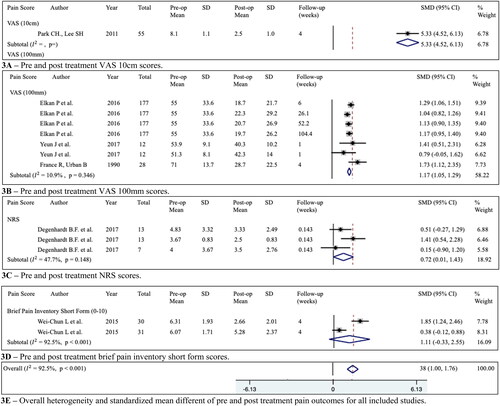
Table 4. Inflammatory biomarker changes following different treatments were reported as standardized mean difference and 95% confidence intervals. Grading of recommendations assessment, development and evaluation (GRADE) level of quality assessment.
Table 5. The table presents a detailed summary of the evidence, including statistical model (effect size and associated confidence intervals, regression data and the certainty of evidence).
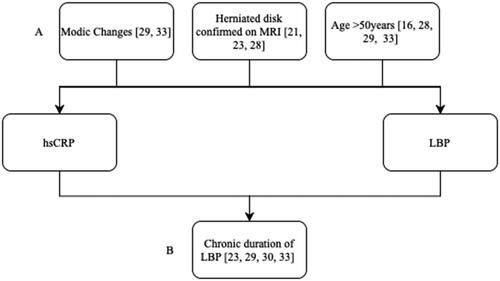
Figure 4. Relationship between hsCRP, LBP and confounding (A) factors (modic changes, herniated disk confirmed on MRI and age) and collider (B) factors (chronic duration of LBP) that are included in the studies analysed.
Supplemental Material
Download MS Word (21.5 KB)Data availability statement
The authors confirm that the data supporting the findings of this study are available within the article [and/or] its supplementary materials.