Figures & data
Table 1. Factors influencing pedestrian route choice based on empirical studies.
Table 2. Average Walk Score®. analysis for N = 26 street segments included in the study area.
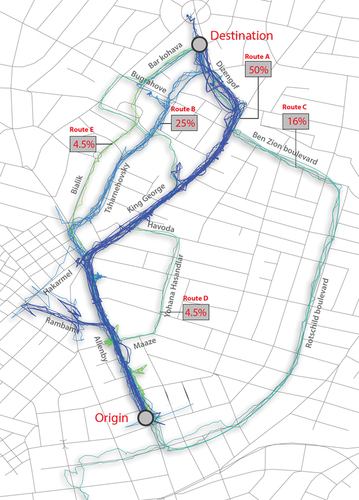
Figure 1. A mapping showing the spatial distribution of participants’ walking routes (retrieved from the GPS app recording) from the origin to the destination within the study area. The origin and destination pair specifically chosen for the leisure walk (fixed across participants) is indicated by a circle on the map.

Table 3. An overview of the post-walk survey structure. Items are categorized by topic and response scale.
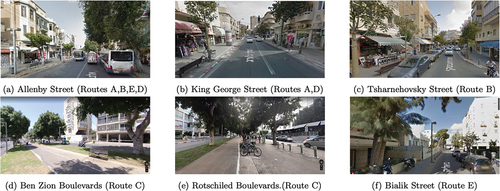
Figure 2. An overview of the streets traversed by participants across the five walking paths in the real-world field study (images captured from Google Street View).

Table 4. The distribution of participants’ choice of walking route showing the % of participants who walked in each of the five routes (A-E).
Table 5. Participants’ choice (in %) of first, second and third most important walking considerations, sampled as part of the post-walk survey. Items that were not chosen are not mentioned in this table.
Table 6. Selected statements by participants in response to items 3–5 in the post-walk survey (‘Why was [x]* an important consideration for your choice of walking path?’). Participants unstructured responses were manually classified as either ‘avoidance’ or ‘attraction’ statements.
Figure 4. % of participants’ unstructured responses classified as ‘avoidance’ or ‘attraction’ statements. Responses are for items 3–5 in the post-walk survey, answering the question: ‘Why was [x]* an important consideration for your choice of walking path?’.
![Figure 4. % of participants’ unstructured responses classified as ‘avoidance’ or ‘attraction’ statements. Responses are for items 3–5 in the post-walk survey, answering the question: ‘Why was [x]* an important consideration for your choice of walking path?’.](/cms/asset/49a6f1b4-14a9-4a4f-9f27-6eec1eb0edb5/cjud_a_2237468_f0004_oc.jpg)
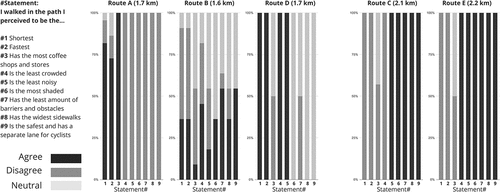
Figure 5. Participants’ agreement with statements regarding their chosen walking path. Agreement levels were measured on a 3-point Likert scale (agree, disagree, neutral) for various statements, such as the path being the shortest, fastest, having the most coffee shops and stores, least crowded, least noisy, most shaded, least number of barriers, widest sidewalks, and separation from cyclists.


