
Figures & data
Figure 1. Study area: the conurbation of Barcelona and its different urban shapes.
Source: The authors.
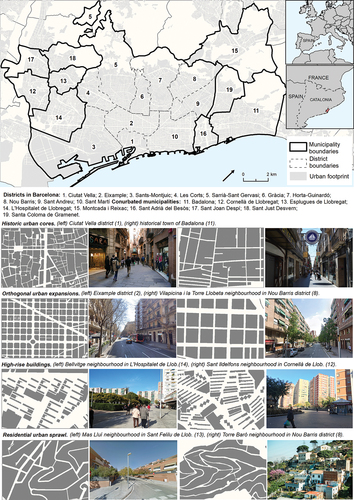
Figure 2. Built environment and socioeconomic characteristics of the study area: a) population density, b) contact opportunity, c) accessibility, d) urban vulnerability, e) concentration of tourist accommodations.
Source: The authors.
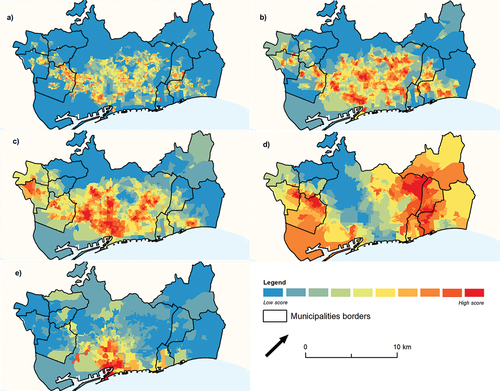
Table 1. Summary of the data.
Table 2. Generalized linear model regression (binomial distribution and a logistic link) of the retail and facility mix score.
Figure 3. Clusters according to diversity, vulnerability, and proportion of tourist accommodation scores.
Source: The authors.
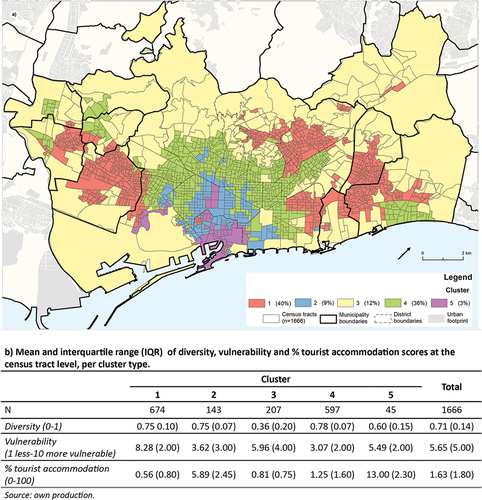
Table 3. Summary of clusters.
Table 4. Proportion (%) of retail and facility activities, per cluster.
Supplemental material