Figures & data
Table 1. Dimensions and characteristics of the conjoint analysis.
Table 2. Sample size(s) and distribution of languages by country.
Figure 1. French speakers and governance attitudes across countries.
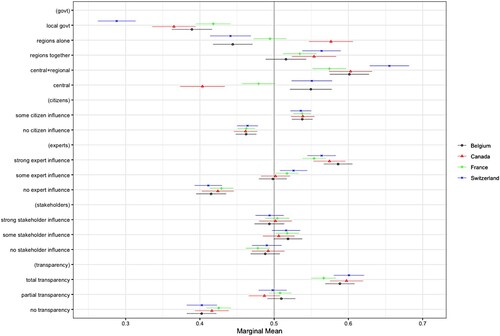
Figure 2. English speakers and governance attitudes across countries.
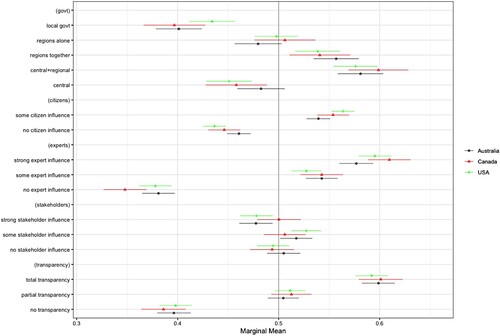
Figure 3. Differences between French speakers by country. Reading example: Belgian francophones are more favourably inclined towards centralization than the French.
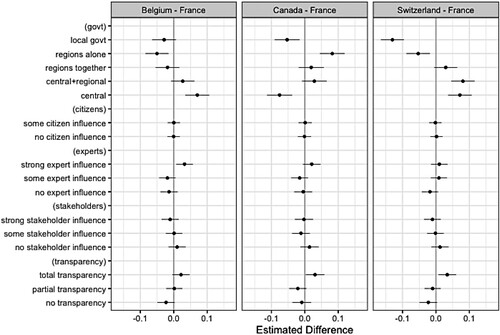
Figure 4. Differences between English and French speakers by residence in Canada. Note: ‘anglo-RoC’ = English speakers living in rest of Canada; ‘anglo-quebecois’ = English speakers living in Quebec; ‘franco-quebecois’ = French speakers living in Quebec; ‘franco-RoC’ = French speakers living in rest of Canada.
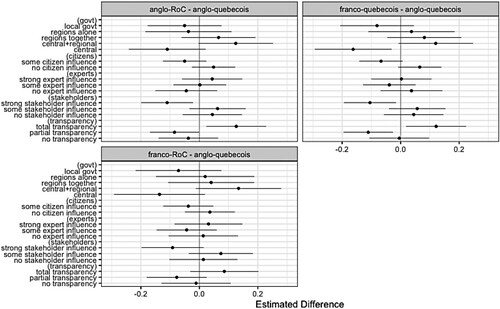
Figure 5. Differences between French and non-French speakers by country.
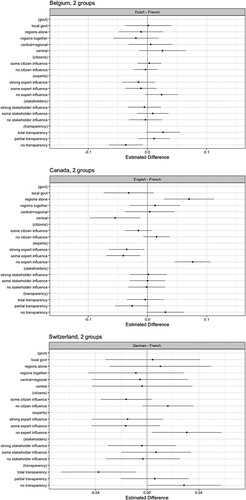
Table 3. ANOVA test results for between-group differences.
Table A1. Sample composition, in % of group and category.
Table A2. Personal COVID-19 unaffectedness by type and group, in % of respondents per group.
Table A3. Power analyses.
Figure A1. Screenshot from the conjoint experiment.
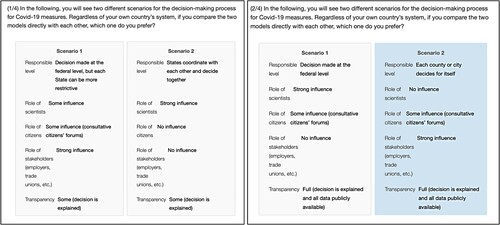
Figure A2. Conditional marginal means for all nine language-country groups.
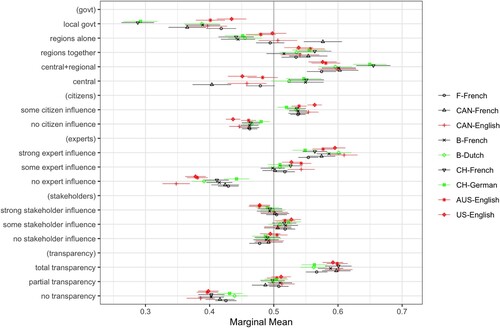
Figure A3. Conditional marginal means for all nine language-country groups, facetted by group.
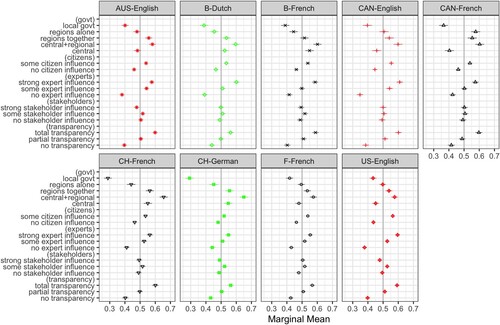
Figure A4. Conditional marginal means for all nine language-country groups, matching respondents only.
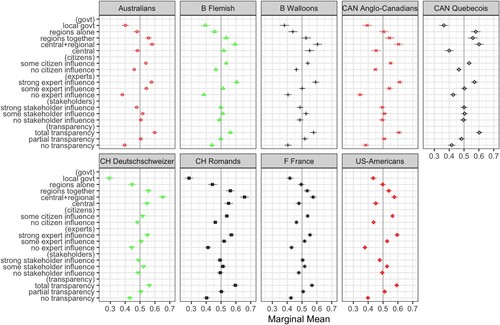
Figure A5. Conditional marginal means for all nine language-country groups, passed attention check only.
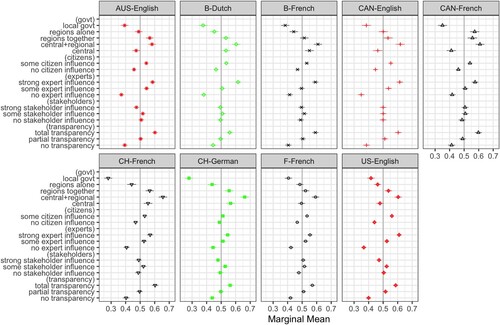
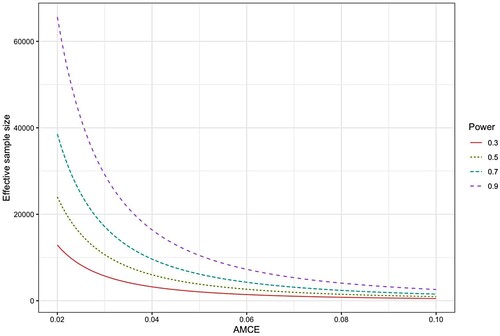
Figure A6. Minimum required effective sample sizes. Note: shown are the required effective sample sizes ( = N individuals * N scenarios * N iterations) for a conjoint experiment with a maximum of five levels ( = the responsible government, in our case) to detect effect sizes AMCE > 0.02 and < 0.1 by the different levels of statistical power for our sub-samples (cf. ) at significance level 0.05. Graph made using the cjpowR package developed by Schuessler and Freitag (Citation2020).