Figures & data
Table 1. Descriptive Statistics iIncidence of disabilities, numeracy and confounding factors.
Table 2. Relative risk ratio estimates [standard error] for incidence of disability.
Figure 1. Incidence of moderate to severe disabilities by type in 2018–2019 and in 2020–2021 academic years. Sources: RISE Data 2018–2019. Gates Data 2020–2021.
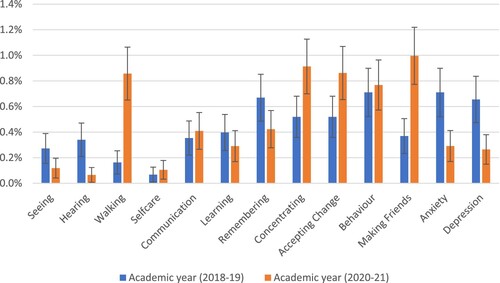
Table 3. Proportion of children with disabilities in 2018–2019 and 2020–2021, by region.
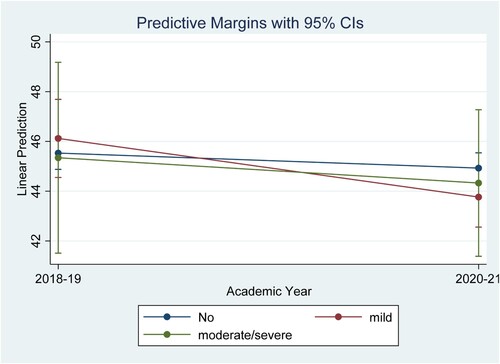
Figure 2. Changes in predicted grade 1 numeracy score over time for children with and without disabilities. Sources: RISE Data 2018–2019. Gates Data 2020–2021.
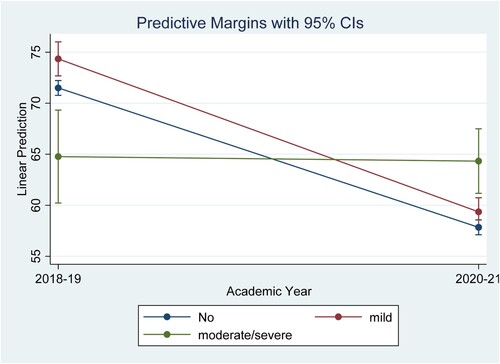
Figure 3. Changes in predicted grade 4 numeracy score over time for children with and without disabilities. Sources: RISE Data 2018–2019. Gates Data 2020–2021.