
Figures & data
Figure 1. The conceptual framework.
The conceptual framework showing the hypotheses.
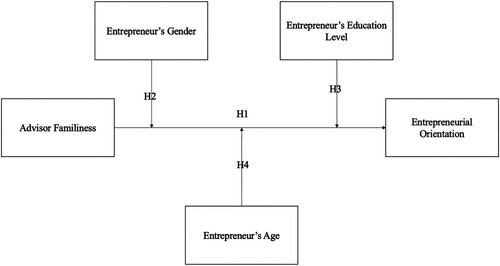
Table 1. Descriptive statistics and correlations.
Table 2 . CFA results of EO.
Table 3 . The regression results.
Figure 2. Interaction Plot between Advisor Familiness and Gender. I
nteraction plot between advisor familiness and gender showing that gender attenuates the familiness-EO relationship.

Figure 3. Interaction Plot between Advisor Familiness and Education Level.
Interaction plot between advisor familiness and education level showing that education level attenuates the familiness-EO relationship.
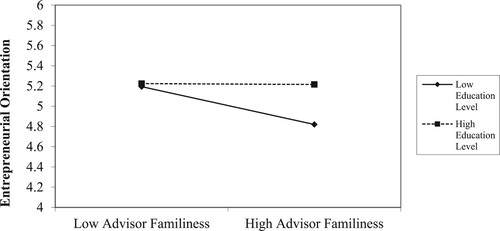
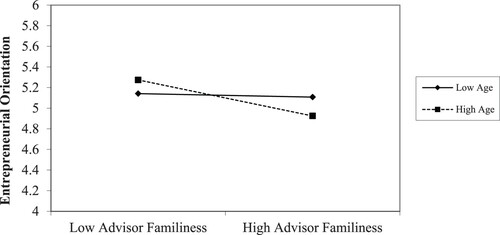
Figure 4. Interaction Plot between Advisor Familiness and Age.
Interaction plot between advisor familiness and age showing that age strengthens the familiness-EO relationship.
Data availability statement
Data can be supplied upon reasonable request.