Figures & data
Table 1. Baseline characteristics by treatment group of all participants who received at least one dose of oral estetrol (E4) or placebo.
Figure 1. Mean (2.5th–97.5th percentile) thrombogram of the entire baseline cohort (n = 168) and mean thrombograms (95% confidence interval [CI] of the mean) after 12 weeks of treatment. Mean thrombogram of the entire baseline cohort is represented by the yellow line and 2.5th–97.5th percentiles, indicating reference ranges, are represented by yellow dotted lines. Women treated with placebo or E4 2.5 mg, 5.0 mg, 10 mg and 15 mg are represented in blue, red, orange, pink and purple, respectively. None of the mean thrombograms were outside the reference range established at baseline, demonstrating the low impact of estetrol (E4) on the entire coagulation process.
![Figure 1. Mean (2.5th–97.5th percentile) thrombogram of the entire baseline cohort (n = 168) and mean thrombograms (95% confidence interval [CI] of the mean) after 12 weeks of treatment. Mean thrombogram of the entire baseline cohort is represented by the yellow line and 2.5th–97.5th percentiles, indicating reference ranges, are represented by yellow dotted lines. Women treated with placebo or E4 2.5 mg, 5.0 mg, 10 mg and 15 mg are represented in blue, red, orange, pink and purple, respectively. None of the mean thrombograms were outside the reference range established at baseline, demonstrating the low impact of estetrol (E4) on the entire coagulation process.](/cms/asset/fbdfdca8-0c06-460a-acd7-24f00985ee0a/icmt_a_2292066_f0001_c.jpg)
Figure 2. Spaghetti plot of individual data comparing the baseline endogenous thrombin potential (ETP), peak and mean velocity rate index (mVRI) and absolute changes from baseline versus week 12 (visit 4). Changes from baseline were assessed using ordinary one-way analysis of variance with a Dunnett’s multiple comparison test. Only differences versus placebo are reported. E4, estetrol.
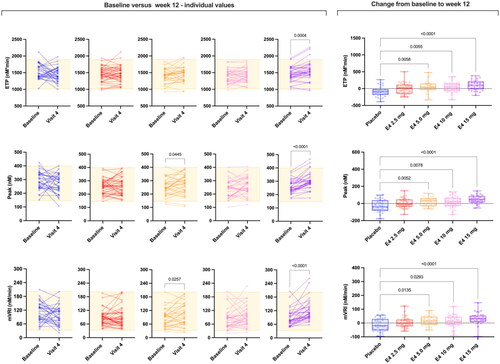
Figure 3. Spaghetti plot of individual data comparing baseline lag time and time to peak and absolute changes from baseline versus week 12 (visit 4). Changes from baseline were assessed using ordinary one-way analysis of variance with a Dunnett’s multiple comparison test. Only differences versus placebo are reported. E4, estetrol.
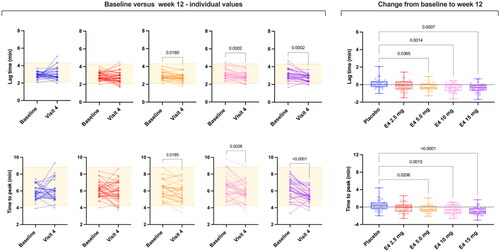
Table 2. Thrombin generation parameters with different doses of estetrol (E4) (from 2.5 mg to 15 mg once daily) at baseline and after 12 weeks of treatment.
Table 3. Reference intervals (2.5th–97.5th percentile of entire baseline cohort) of thrombin generation parameters and out-of-range results after 12 weeks of treatment.
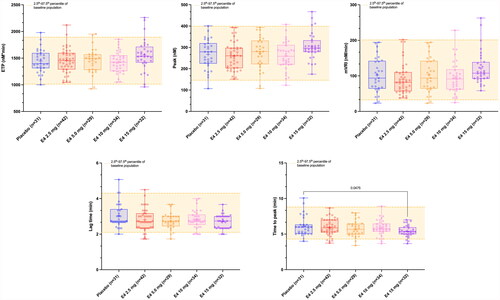
Figure 4. Comparison of thrombin generation assay (TGA) parameters after 12 weeks of treatment.