
Figures & data
Figure 1. Hepatocellular lipotoxicity is induced by BPA. (A) TC and (B) TG content of HepG2 cells were accessed by ELISA. (C) Images (200x) and quantitative analysis of lipid accumulation in HepG2 cells. *p < 0.05; **p < 0.01. BPA: bisphenol A; TC: total cholesterol; TG: triglyceride; ns: no significance.
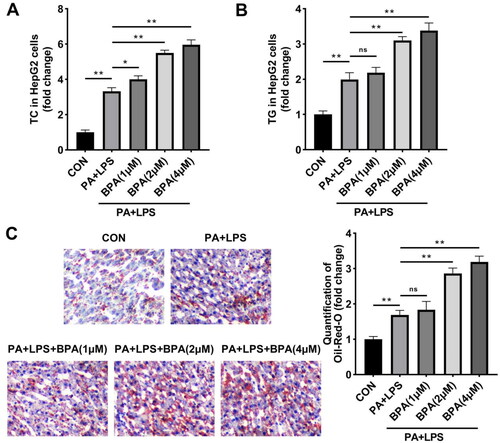
Figure 2. BPA facilitates pyroptosis of steatotic HepG2 cells. (A) Scatter diagram and (B) quantitative analysis of pyroptosis performed by flow cytometry. (C) Protein brands and quantitative analysis of NLRP3 inflammasome evaluated by western blot. **p < 0.01. ns: no significance.
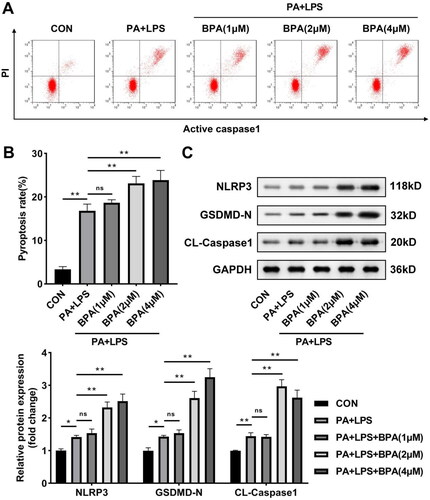
Figure 3. BPA promotes O-GlcNAcylation in NAFLD. Representative protein brands and quantitative analysis of protein levels of O-GlcNAcylation, OGT, and OGA in HepG2 cells treated with BAP. OGT: O-GlcNAc transferase; OGA: O-GlcNAcase; BPA: bisphenol A.
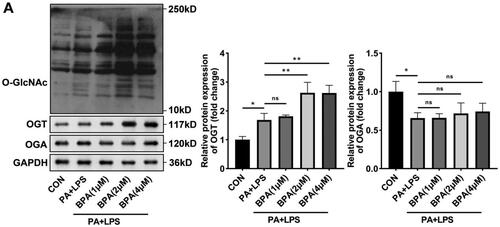
Figure 4. Knockdown of OGT inhibits lipotoxicity and pyroptosis induced by BPA. (A) mRNA of OGT in HepG2 cells determined by RT-qPCR. (B) Protein levels of O-GlcNAcylation in HepG2 cells after knockdown of OGT. (C) TC and (D) TG content of HepG2 cells were accessed by ELISA. (E) Images (200x) and quantitative analysis of lipid accumulation in HepG2 cells after knockdown of OGT. (F) Scatter diagram and quantitative analysis of pyroptosis performed by flow cytometry. *p < 0.05; **p < 0.01. TC: total cholesterol; TG: triglyceride; OGT: O-GlcNAc transferase.
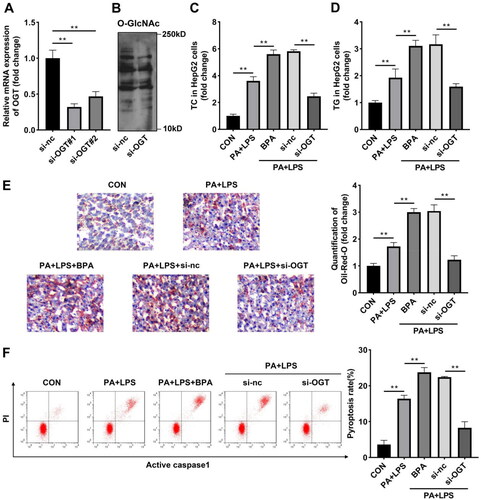
Figure 5. OGT interacts with NLRP3 in vitro. (A) Co-IP and western blot were combined to indicate binding relationship between OGT and NLRP3. (B) Immunofluorescence colocalisation in HepG2 cells revealed that OGT can colocalise with NLRP3. (C) NLRP3 protein levels in HepG2 cells after inhibition of OGT. Co-IP: Co-immunoprecipitation; OGT: O-GlcNAc transferase.
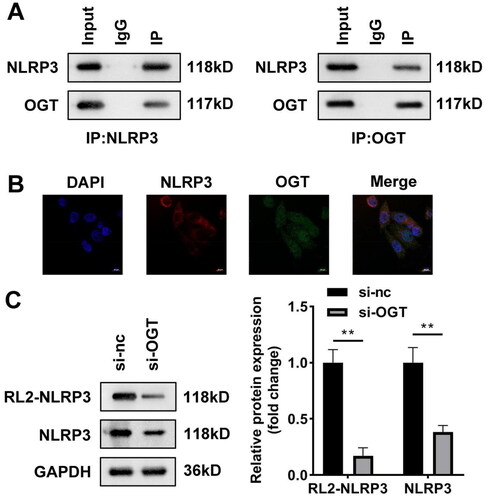
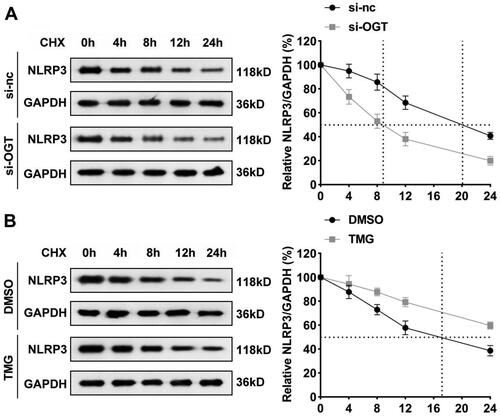
Figure 6. O-GlcNAcylation increases NLRP3 protein stability. The half-life of NLRP3 in HepG2 cells treated with CHX in (A) si-nc and si-OGT; (B) DMOSO reagent control and TMG groups. CHX: cycloheximide; TMG: Thiamet-G.
Data availability statement
Not applicable.