Figures & data
Figure 1. Simulation-based design optimisation procedure (adapted from Krus Citation2003).
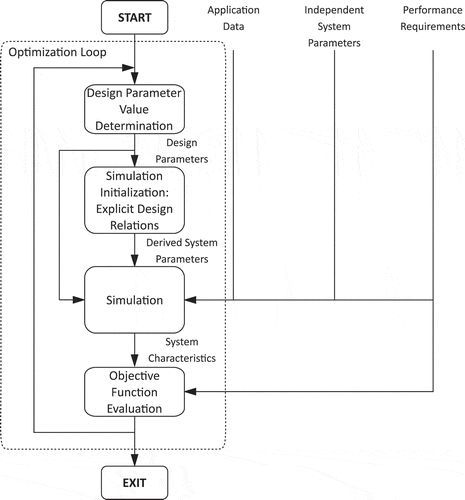
Figure 3. Efficiency maps for in-line pump ((a) and (b)) and bent-axis motor ((c) and (d)) with displacement settings of 1.0, 0.67 and 0.33.
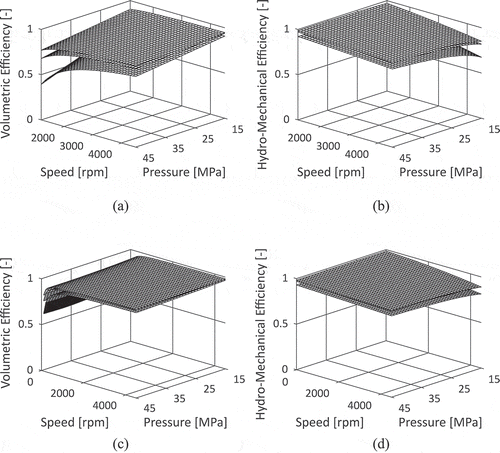
Figure 4. Pump scaling relationships for component mass and maximum continuous speed as functions of component displacement.
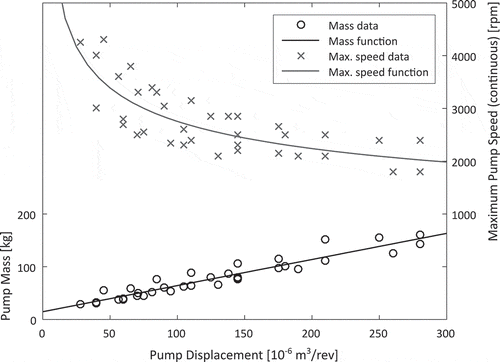
Table 1. Basic vehicle data.
Table 2. Drive cycle comparison (Barlow et al. Citation2009, Tutuianu et al. Citation2013).
Table 3. Design parameter limits.
Figure 5. Distribution of design parameters within design range (relatively) for different drive cycles and cases. Minimum and maximum for each design parameter given as absolute values (psplit is per definition relative).
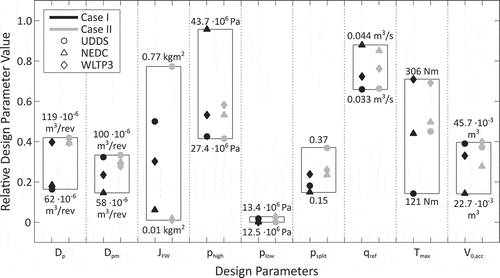
Figure 6. Bubble plot of engine operating points for Case I, UDDS-optimised design, together with wide open throttle curve (maximum torque), scaled BSFC-map and fuel-consumption-minimal operating points (BSFCmin).
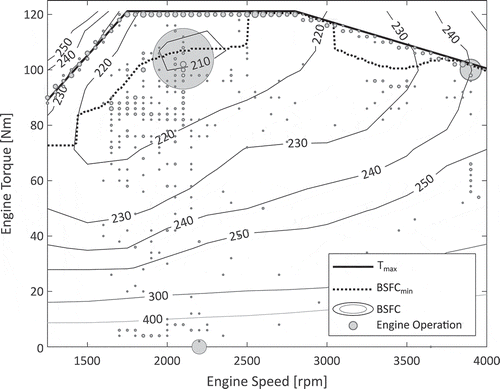
Figure 7. Reference velocity, energy content in system and instantaneous rate of fuel consumption for Case I, UDDS-optimised design during first 400 s of UDDS.
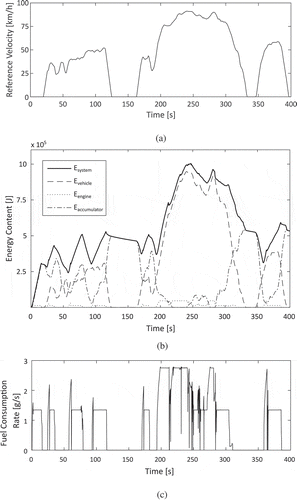
Table 4. Comparison of system’s energy content for non-hybrid (kinetic energy of vehicle and flywheel) and hybrid case (kinetic energy of vehicle and flywheel plus energy content accumulator) for Case I, UDDS-optimised design.
Table 5. Optimised vehicle designs’ fuel consumption (g).
Table 6. Comparison of ARVD for different designs and drive cycles.

