
Figures & data
Table 1. Ecological data, ranking criteria and features used.
Figure 1. Spatial distribution of landfills in different biogeographic regions in Queensland and percentage of the total number of remnant Regional Ecosystems (REs) in each biogeographic regions.
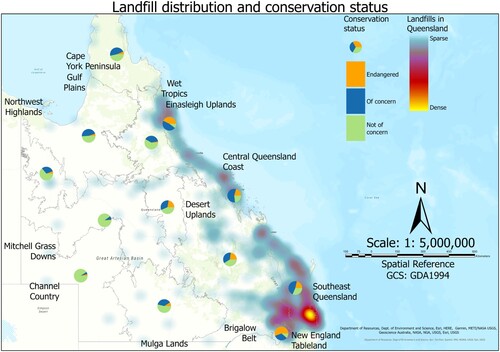
Figure 2. Species density of flora and fauna in different biogeographic regions in Queensland.
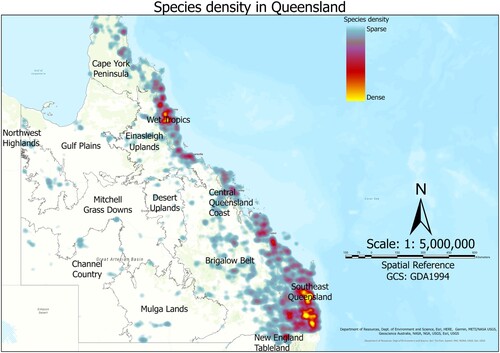
Table 2. Ecological features and percentage coverage of total landfill buffer area.
Figure 3. Environmental scores of landfills and WildNet data in landfill buffers.
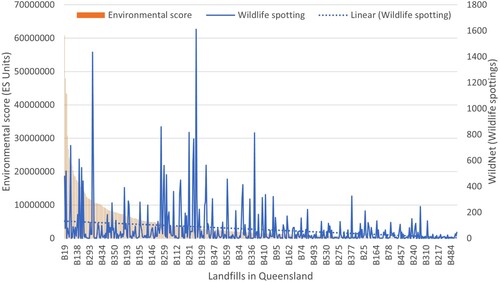
Figure 4. Total environmental scores and habitat scores for landfills in different biogeographic regions in Queensland.
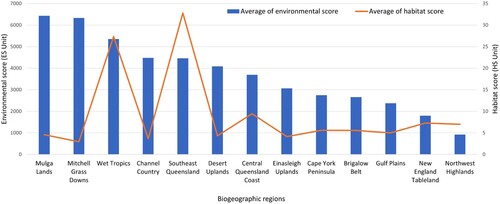
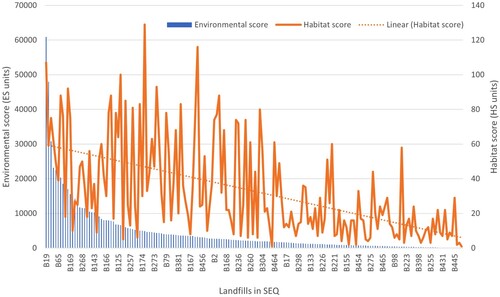
Figure 5. Environmental score and habitat score for all landfills in South East Queensland.
Supplemental material