


Figures & data
Table 1. Fish farm parameters.
Table 2. Parameters for different scenarios of salmon models.
Figure 1. Interpolated (nearest neighbor) market future surfaces for salmon (left) and soy (right) from 01/01/2006 till 01/01/2023. On the x-axis are dates identified by integers, on the y-axis the time-to-maturity and on the z-axis the corresponding price. Deep blue associates a low and yellow a high price.
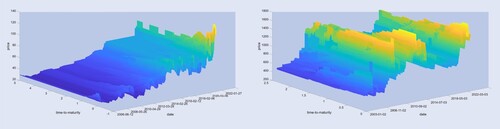
Figure 2. Close spot and future prices for different model parameters.
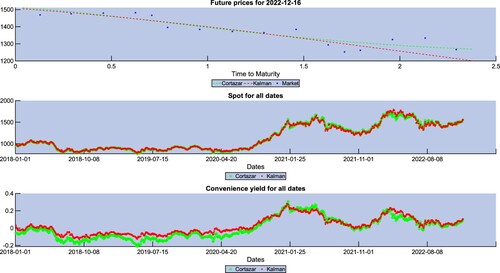
Figure 3. Mean relative changes of salmon (left) and soy (right) prices for the different scenarios in tables and .
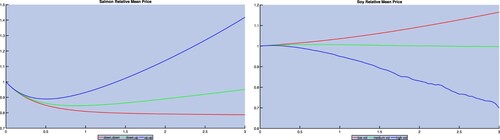
Table 3. Parameters for different scenarios of soybean models.
Table 4. Relative improvements using stochastic feeding costs. Mean with confidence intervals using trials each with
simulations for LSMC.
Table 5. Value of (Equation4(4)
(4) ) using stochastic feeding costs with different stopping rules.
Table A1. Correlation matrix inferred from filtered log-spot prices and convenience yield using two separate Kalman filters for salmon and soybean.
Table A2. Correlation matrix deduced by a joint Kalman filter for salmon and soybean.
Table A3. Correlation matrix inferred from filtered log-spot prices and convenience yield using a joint Kalman filter for salmon and soybean.
Table A4. Relative improvements using stochastic feeding costs with full correlation matrix.
Table A5. Farm values using stochastic feeding costs with full correlation matrix.