Figures & data
Figure 1. Definition initial margin (IM).
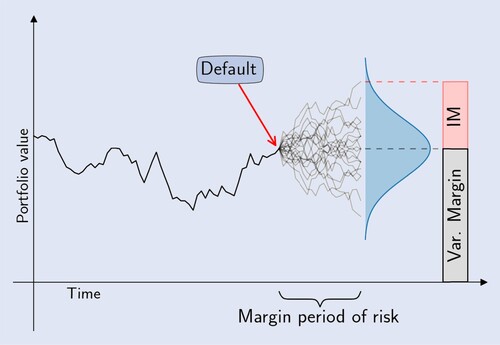
Figure 2. Standard initial margin model (SIMM).
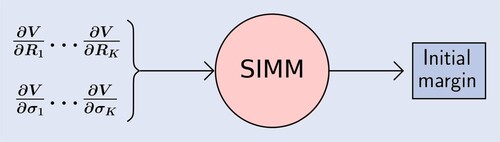
Figure 3. Definition margin value adjustment (MVA).
Figure 4. MVA through static replication.
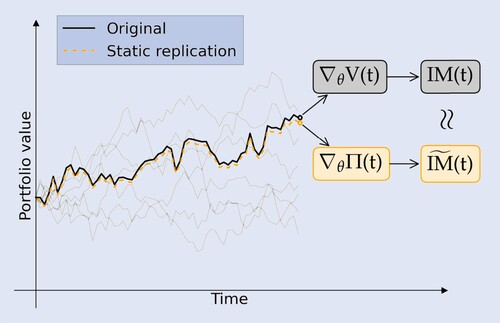
Figure 5. Neural network structures. (a) Fully connected. (b) One-dimensional and (c) Locally connected.

Figure 6. Target functions regress-later: two approaches. (a) Fully static replication and (b) Semi-static replication.
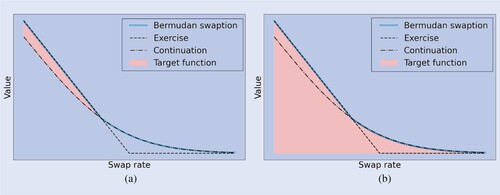
Figure 7. Impact of bumping the market rates (left) and implied volatilities (right) at t-zero (top) and a future simulation date (bottom). All bumps correspond to bucket . (a) Zero-rate bump at t = 0. (b) Instant. volatility bump t = 0. (c) Zero-rate bump at t = 7 and (d) Instant. volatility bump at t = 7.
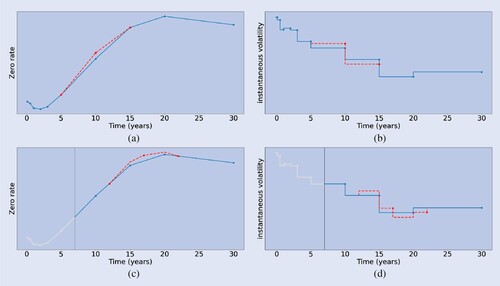
Table 1. Model parameters.
Table 2. estimates Bermudan swaption for different levels of moneyness, presented in basis points of the notional.
Figure 8. Expected positive exposure profile: LSM-bundle (orange) vs. static replication (blue). The LSM and static replication standard error windows are represented by the orange and blue shaded area, respectively, based on 25 independent runs of 3000 MC paths. (a) Bermudan and (b)
Bermudan.
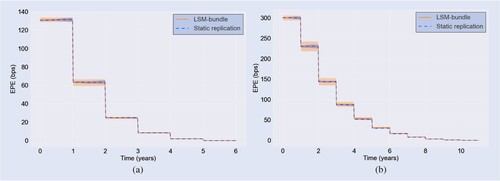
Figure 9. Convergence CVA for a (top) and
(bottom) Bermudan swaption: LSM-bundle (orange) vs. static replication (blue). The LSM and static replication standard error windows are represented by the orange and blue shaded area, respectively.
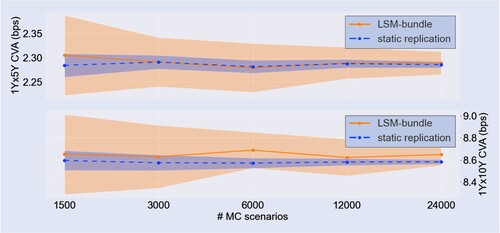
Figure 10. Bucketed Delta sensitivities: LSM bump-and-reval (orange) vs. static replication (blue). The LSM benchmark is based on 25 independent runs of 80,000 MC paths. (a) Bermudan and (b)
Bermudan.
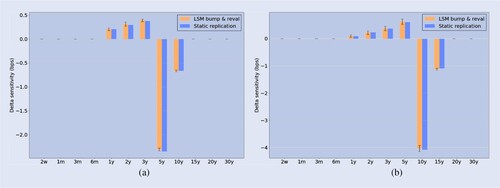
Figure 11. Bucketed Vega sensitivities: LSM bump-and-reval (orange) vs. static replication (blue). The LSM benchmark is based on 80,000 MC paths. (a) Bermudan and (b)
Bermudan.
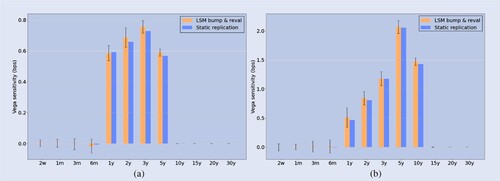
Table 3. IM estimate Bermudan swaption.
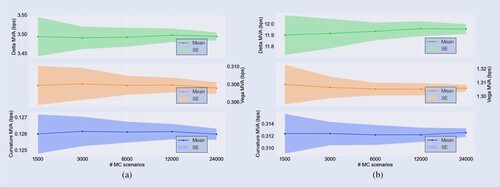
Figure 12. Convergence Delta (top), Vega (middle) and Curvature (bottom) IM: LSM bump-and-reval (orange) vs. static replication (blue). The LSM standard error window is represented by the shaded orange area. (a) Bermudan and (b)
Bermudan.
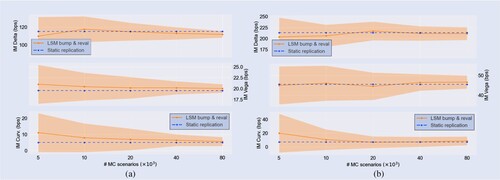
Figure 13. Bucketed Delta (left) and Vega (right) profiles for static replication of a European swaption. SR sensitivities (solid) are shown next to an exact benchmark (dashed). (a) Delta profiles and (b) Vega profiles.
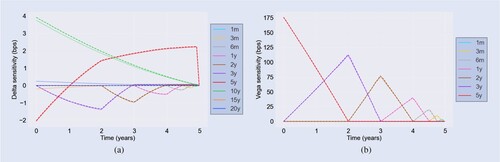
Figure 14. Bucketed Delta profiles for static replication. The standard error windows are represented by the shaded area, based on 3000 MC paths. (a) Bermudan and (b)
Bermudan.
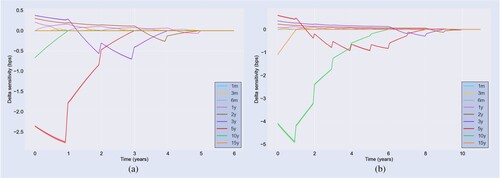
Figure 15. Bucketed Vega profiles for static replication. The standard error windows are represented by the shaded area, based on 3000 MC paths. (a) Bermudan and (b)
Bermudan.
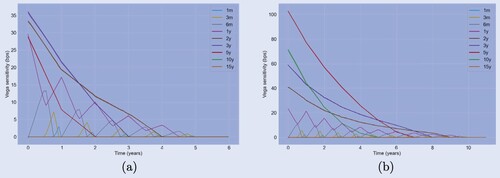
Figure 16. Delta (green), Vega (orange) and Curvature (blue) margin profiles for static replication. The standard error windows are represented by the shaded area, based on 3000 MC paths. (a) Bermudan and (b)
Bermudan.
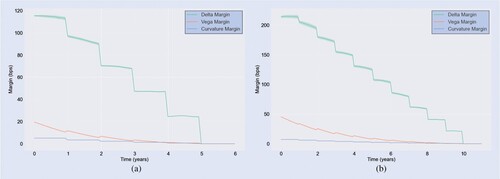
Figure 17. Convergence Delta (top), Vega (middle) and Curvature (bottom) MVA for static replication. The standard error windows are represented by the shaded areas. (a) Bermudan and (b)
Bermudan.