Figures & data
Figure 1. Screenshot sequence of the lateral ankle sprain. The pictures show initial ground contact (1), foot placement after sliding at 20 ms (2), the course of injury at 105 and 155 ms (3,4), maximum joint distortion at 195 ms (5), recovery and second foot touching the force plate at 255 ms (6).
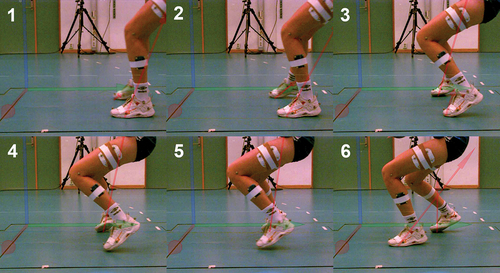
Figure 2. Ankle angles and moments before and after ground contact. 0 ms indicates initial ground contact. The bold line represents the injury trial, while the shaded area represents the mean and standard deviation of the reference trials.
Figure 3. Knee angles and moments before and after ground contact. 0 ms indicates initial ground contact. The bold line represents the injury trial, while the shaded area represents the mean and standard deviation of the reference trials.
Figure 4. Center of mass (COM) position, velocity, and acceleration. The bold line represents the injury trial, while the shaded area represents the mean and standard deviation of the reference trials.
Figure 5. Ground reaction forces (GRFs) after initial ground contact. The bold line represents the injury trial, while the shaded area represents the mean and standard deviation of the reference trials.
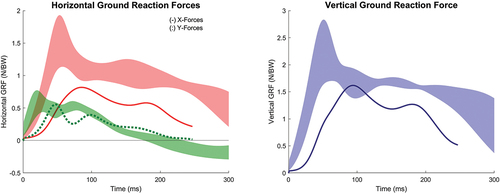
Figure 6. Traction coefficient during the ground contact phase. The bold line represents the injury trial.
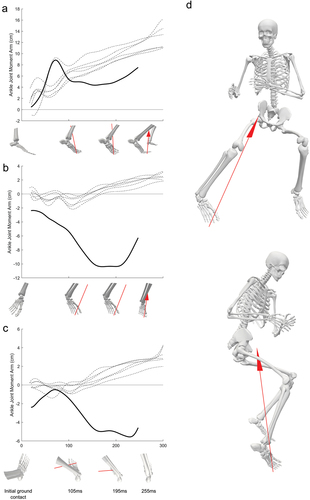
Figure 7. Ankle joint moment arm time curves and ankle joint position at highlighted timepoints in the sagittal (A), frontal (B), and transverse planes (C). The full body skeleton (D) shows the athletes body alignment and GRF at highest ankle excursion (195 ms) from a frontal and lateral perspective.