
Figures & data
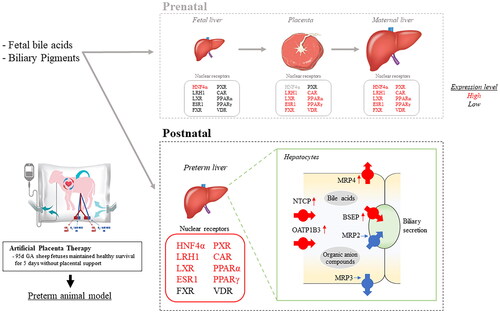
Table 1. Comparison of fetal general data at necropsy.
Table 2. Compared blood hepatic biochemical data in the APT Group with the Control Group.
Figure 1. Changes in mRNA expression of NRs in the placenta from 95d to 100d GA. Box plots indicate relative fold changes of mRNA expression of NRs in 95d GA with 100d GA in the placenta. The yellow box indicates 95d GA and the green box indicates the 100d GA. *p < .05 vs. control (t test). NRs: nuclear receptors; GA: gestational age; HNF4α: hepatocyte nuclear factor-4 alpha; LRH1: liver receptor homolog-1; LXR: liver X receptor; ESR1: estrogen receptor-1; FXR: farnesoid X receptor; PPAR: peroxisome proliferator-activated receptor; VDR: vitamin D receptor.
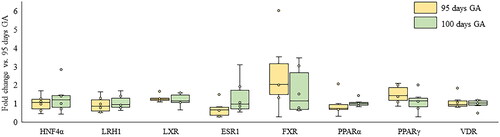
Figure 2. Changes in mRNA expression of NRs in the fetal liver between APT Group and Control Group. Box plots indicated a relative fold change of mRNA expression of NRs in the APT Group with the Control Group in the fetal liver. (A-J) *p < .05 vs. control (t test). NRs: nuclear receptors; APT: artificial placenta therapy; HNF4α: hepatocyte nuclear factor-4 alpha; LRH1: liver receptor homolog-1; LXR: liver X receptor; ESR1: estrogen receptor-1; FXR: farnesoid X receptor; PXR: pregnane X receptor; CAR: constitutive androstane receptor; PPAR: peroxisome proliferator-activated receptor; VDR: vitamin D receptor.
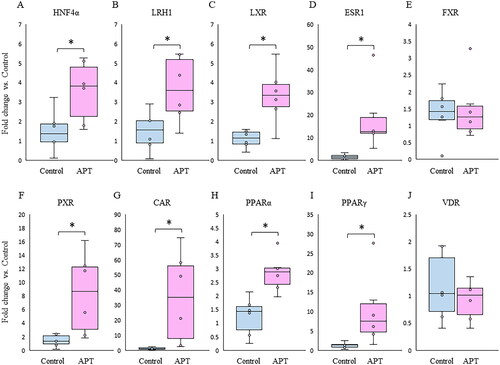
Figure 3. Changes in mRNA expression of hepatobiliary transporters between APT Group and Control Group. Box plots indicated a relative fold change of mRNA expression of hepatobiliary transporters in the APT Group with the Control Group in the fetal liver. (A–C) BAs transporters are shown: uptake (NTCP) and efflux (BSEP and MRP4). (D–F) OA compounds transporters are shown: uptake (OATP1B3) and efflux (MRP2 and MRP3). *p < .05 vs. control (t test). **p < 0.05 vs. control (Mann-Whitney U-test). APT: artificial placenta therapy; BAs: bile acids; OA: organic anion; NTCP: sodium taurocholate co-transporting polypeptide; OATP1B3: organic anion transporting polypeptide-1B3; BSEP: bile salt export pump; MRP: multidrug resistance protein.
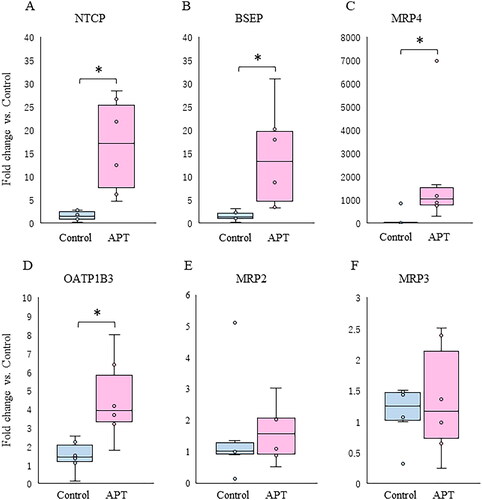
Figure 4. Inflammatory cytokines and histological assessment in the fetal liver. The expression of inflammatory cytokines TNF-α (A), IL-6 (B), and IL-1β (C) mRNA in the APT Group compared to the Control Group. Representative HE staining (magnification 200×) and TUNEL staining (magnification 200×) sections from the Control Group (D,F), the APT Group (E,G), and positive control treated DNase I(H) were shown. Red arrows indicate apoptotic changes by treated DNase I. Scale bar = 100 μm. *p < .05 vs. control (t test). TNF-α: tumor necrosis factor-alpha; APT: artificial placenta therapy; HE: Hematoxylin and Eosin; TUNEL: terminal deoxynucleotidyl transferase dUTP Nick End Labeling.
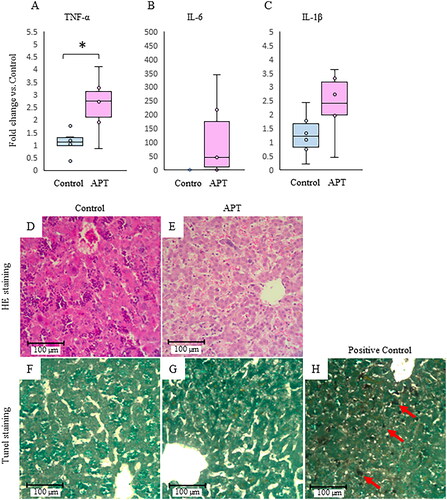
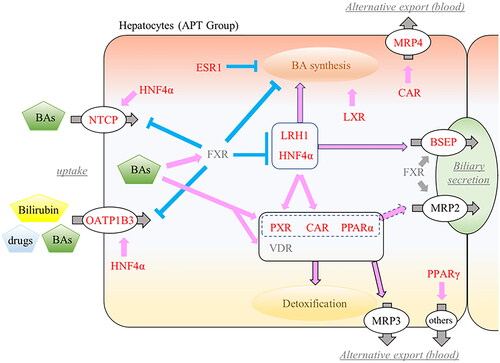
Figure 5. Overview of changes in fetal hepatic NRs and hepatobiliary transporters. Activated NRs by ligands (BAs, bilirubin, and drugs) promote (pink) or suppress (blue) expression of other NRs or target transporters. Increased mRNA expressions were highlighted in red. NRs: nuclear receptors; APT: artificial placenta therapy; BAs: bile acids; HNF4α: hepatocyte nuclear factor-4 alpha; LRH1: liver receptor homolog-1; LXR: liver X receptor; ESR1: estrogen receptor-1; FXR: farnesoid X receptor; PXR: pregnane X receptor; CAR: constitutive androstane receptor; PPAR: peroxisome proliferator-activated receptor; VDR: vitamin D receptor; NTCP: sodium taurocholate co-transporting polypeptide; OATP1B3: organic anion transporting polypeptide-1B3; BSEP: bile salt export pump; MRP: multidrug resistance protein.
Supplemental Material
Download Zip (266.9 KB)Data availability statement
The data that support the findings of this study are openly available in Figshare.
Appendix 1: http://doi.org/10.6084/m9.figshare.24550780.
Appendix 2: http://doi.org/10.6084/m9.figshare.24180687.