Figures & data
Figure 1. Temperature–time diagram for the heating of a substance (Regin, Solanki, and Saini Citation2008).
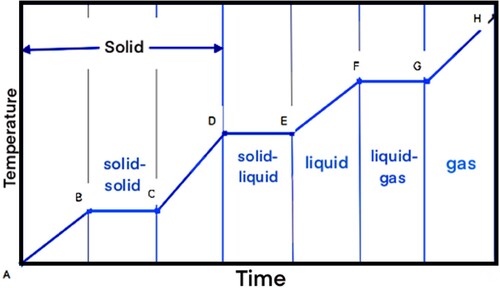
Table 1. Typical materials used in sensible heat TES systems (Cabeza et al. Citation2015).
Table 2. Typical materials used in latent heat TES storage (Cabeza et al. Citation2015).
Figure 2. Classification of PCMs.
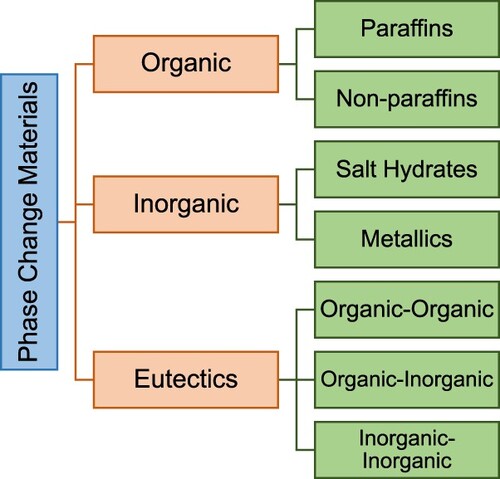
Table 3. Physical properties of some paraffins (Sharma et al. Citation2009).
Table 4. Physical properties of some non-paraffins (Sharma et al. Citation2009).
Figure 3. Typical geometries of PCM containers (Agyenim et al. Citation2010).
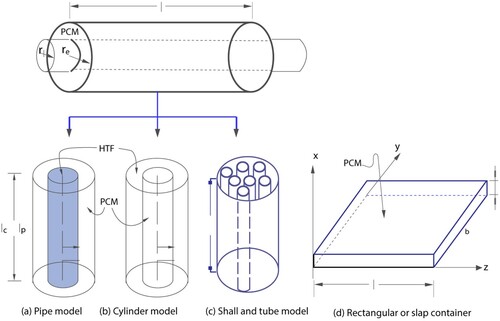
Figure 4. Different containment schematics used in LHTS systems (Regin, Solanki, and Saini Citation2008): (a) flat plate; (b) shell and tube with internal flow; (c) shell and tube with parallel flow; (d) shell and tube with cross flow; (e) sphere packed bed.
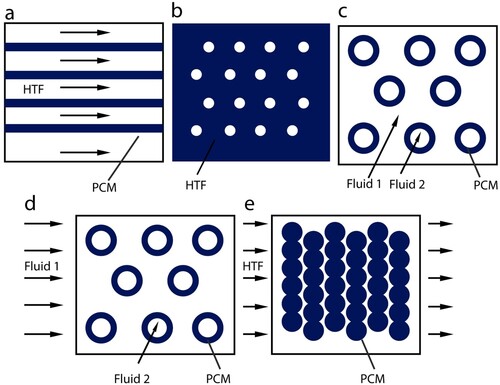
Figure 5. (a) Schematic of a PCM bed TES tank with spherical capsules, (b) HTF flow around PCM (He et al. Citation2022).
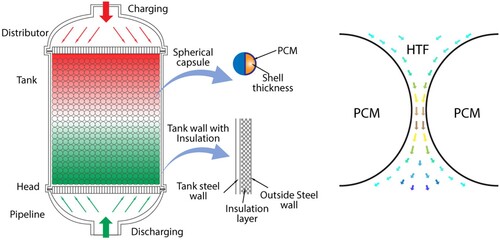
Figure 6. The TES system operation modes (He et al. Citation2022).
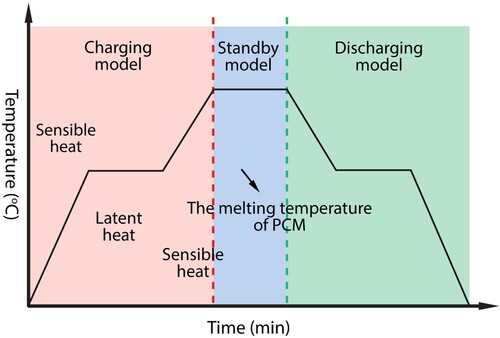
Figure 7. Shell-and-tube unit (Trp Citation2005).
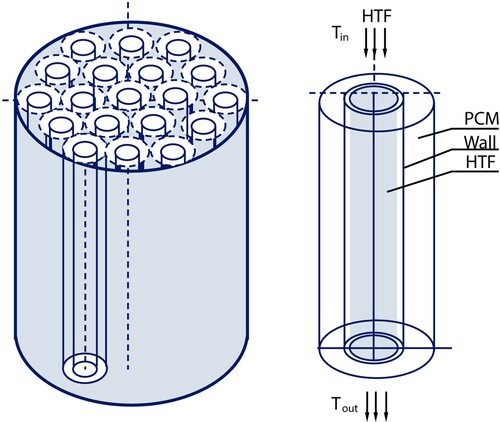
Figure 8. Module arrangement of PCM containment (Zeinelabdein, Omer, and Gan Citation2018).
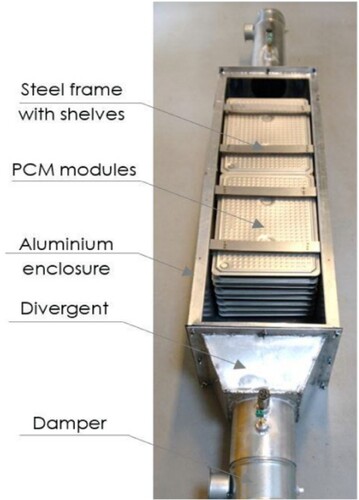
Figure 9. Effect of inlet temperature on the (a) total melting time and (b) solidification time (Avci and Yazici Citation2013).
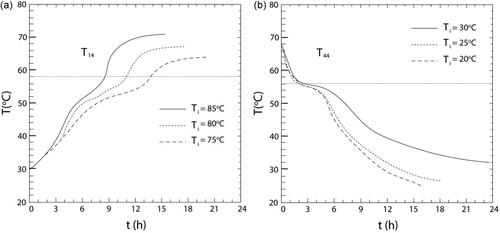
Figure 10. Schematic of experimental setup (Nallusamy, Sampath, and Velraj Citation2006).
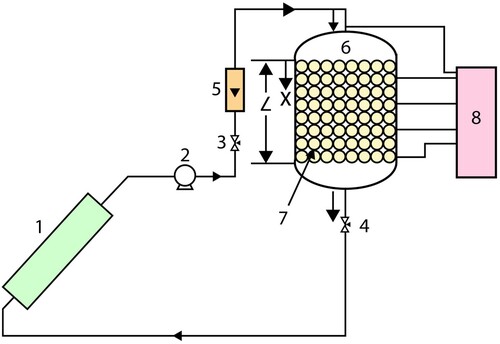
Table 5. Main outcomes for each material.
Figure 11. 2D model geometry.
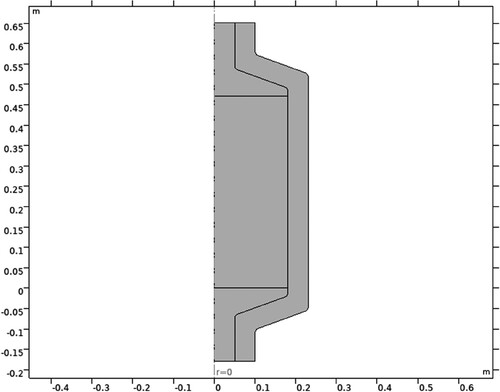
Figure 12. 3D model geometry.
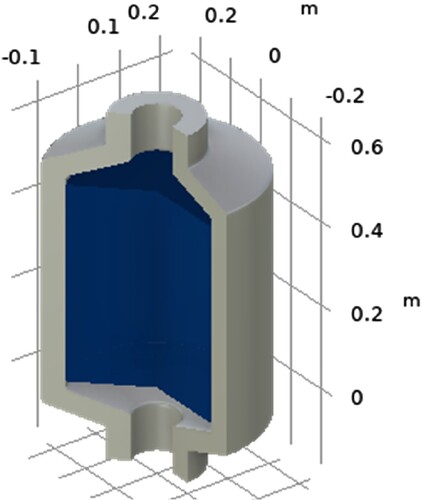
Figure 13. Boundary conditions.
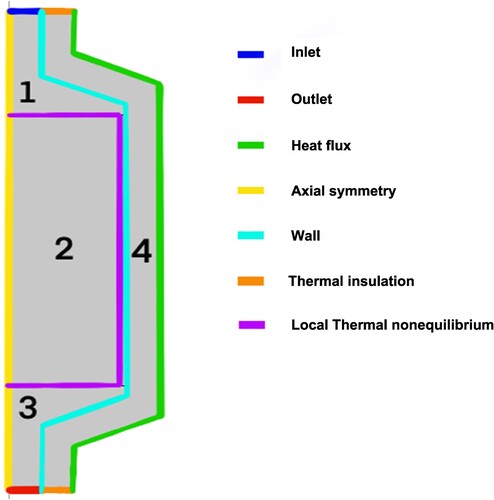
Table 6. Specification of the TES tank.
Figure 14. Mesh configuration.
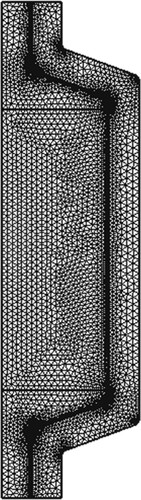
Table 7. Material selection.
Table 8. Mesh statistics.
Figure 15. (a) HTF Temperature, (b) PCM Temperature (Nallusamy, Sampath, and Velraj Citation2006).
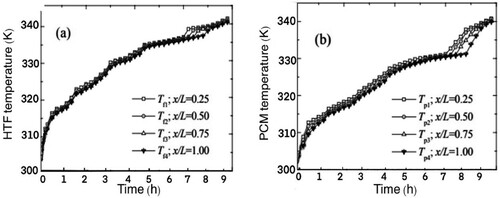
Figure 16. COMSOL results. PCM and HTF temperature distribution.
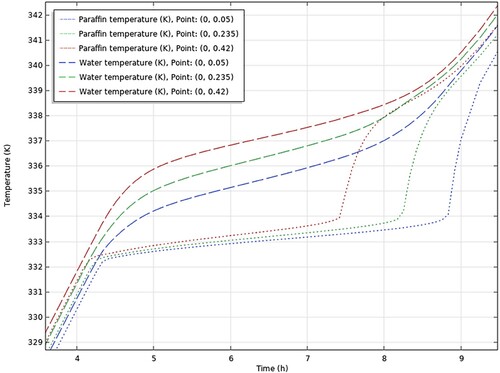
Figure 17. COMSOL results. PCM & HTF temperatures of TES tank using RT30.
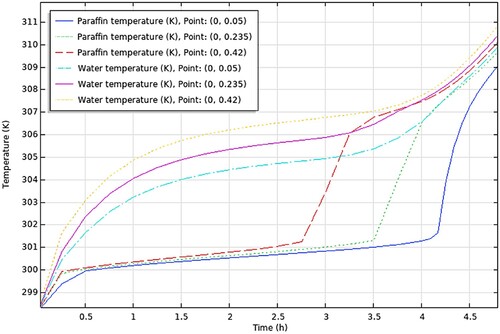
Figure 18. COMSOL results. PCM & HTF temperatures of TES tank using RT28HC.
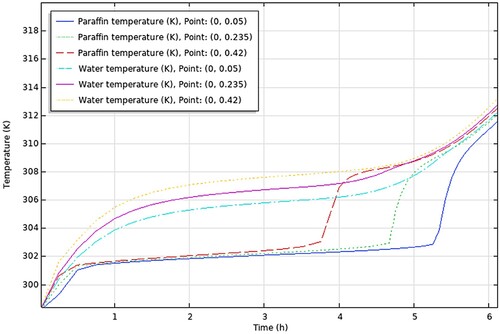
Figure 19. COMSOL results. PCM & HTF temperatures of TES tank using WAX.
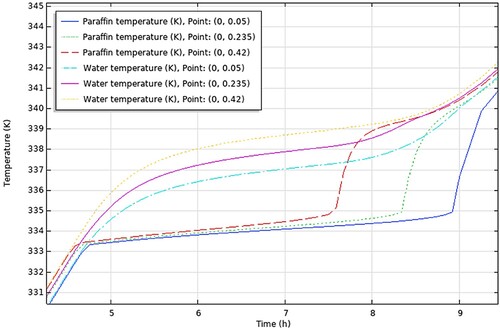
Figure 20. COMSOL results. PCM & HTF temperatures of TES tank using RT58.
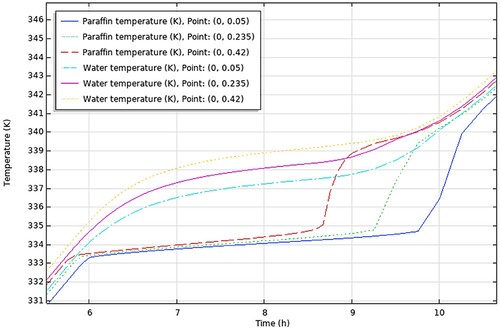
Figure 21. COMSOL results. PCM & HTF temperatures of TES tank using P56-58.
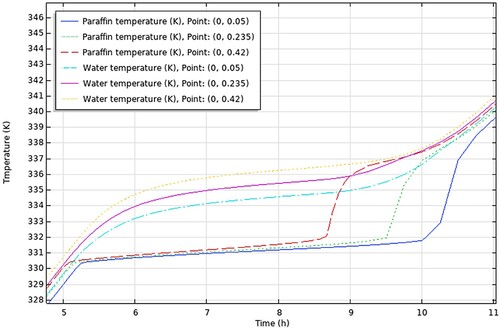
Figure 22. COMSOL results. The effect of varying porosity.
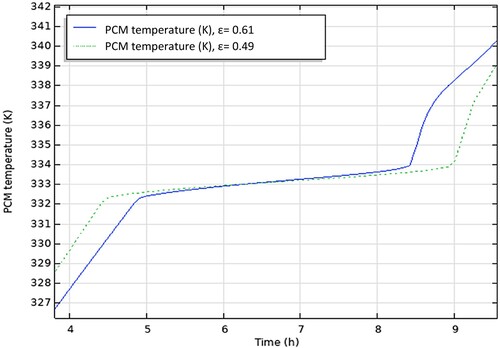
Figure 23. COMSOL results. The effect of varying the HTF flow rate.
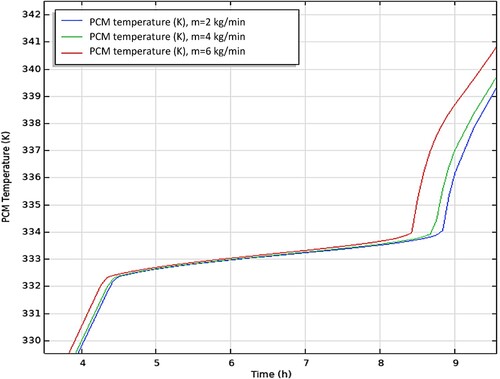
Table 9. Charging characteristics of the PCMs.
Table 10. Thermophysical properties of the different paraffins.
Table 11. Heat added to the PCM during charging for each TES tank.
Table 12. Heat capacity of TES tanks with each paraffin.
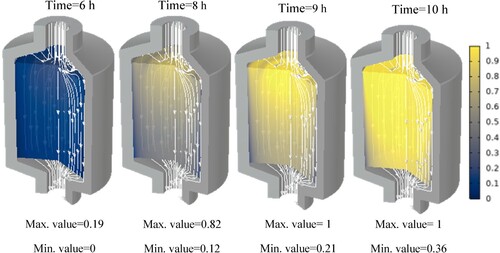
Figure A1. Phase distribution of TES tank using paraffin RT30.
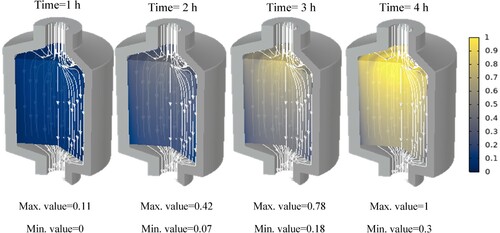
Figure A2. Phase distribution of TES tank using paraffin RT28HC.
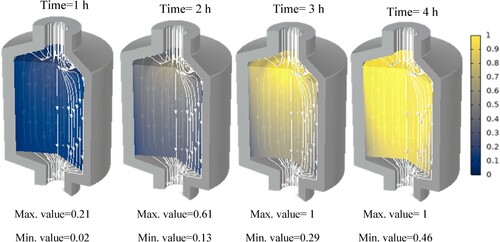
Figure A3. Phase distribution of TES tank using paraffin WAX..
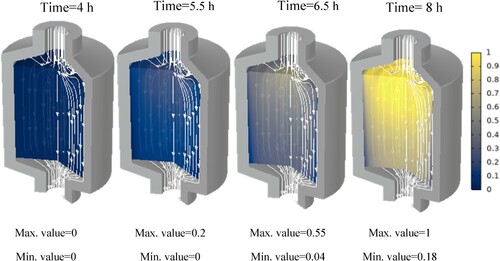
Figure A4. Phase distribution of TES tank using paraffin RT58.
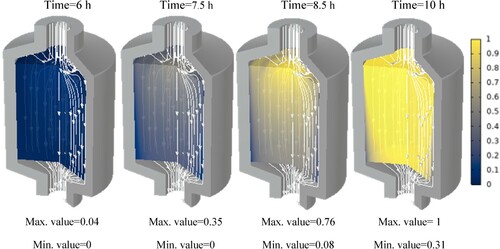
Figure A5. Phase distribution of TES tank using paraffin P56-58.