Figures & data
Figure 1. Dezonnet configuration.
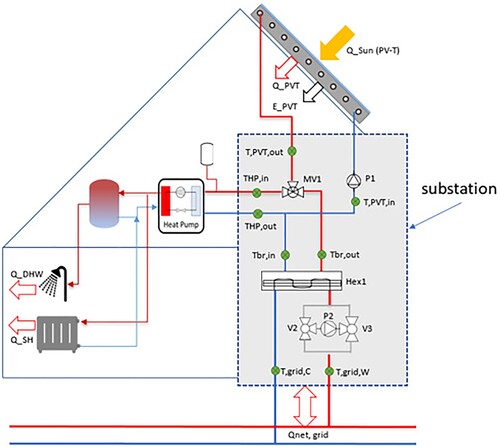
Figure 2. Substation hydraulic and control model (Wanda).
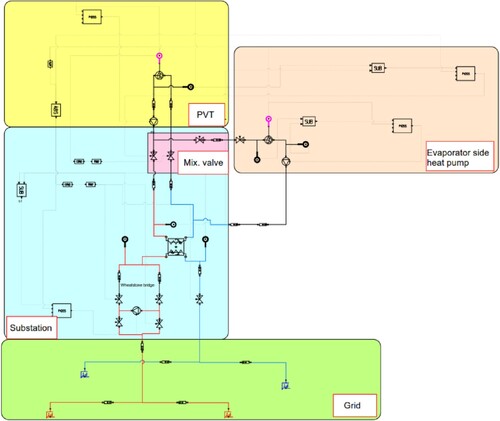
Table 1. Overview of control setpoint values per operational mode.
Figure 3. State-transition diagram of the novel PVT-based 5GDHC substation.
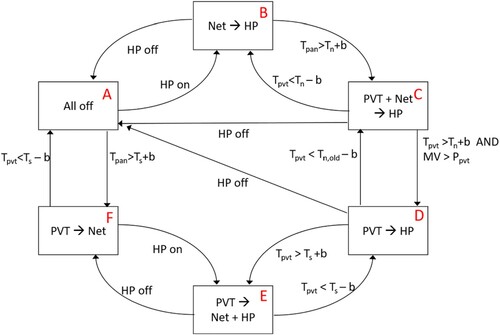
Table 2. Control setting of the three substation pumps.
Table 3. Control settings of the mixing tap of the substation set.
Figure 4. C →B: House heat demand in kW (bottom green line) and heat supply PVT (top red line).
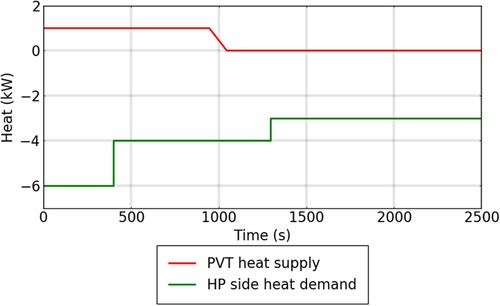
Figure 5. C →B: Control setpoint for HP evaporator side. DT before and after the heat-pump is 7 K.
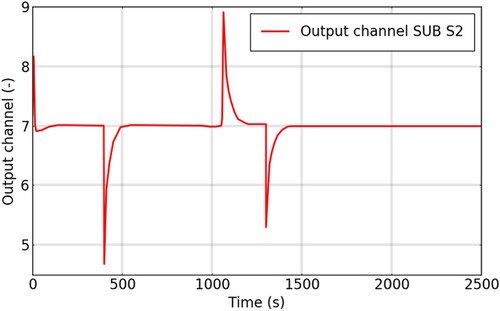
Figure 6. C → B: Pump rotational speed controlled (Top green line: network pump speed, bottom red line: HP inlet speed).
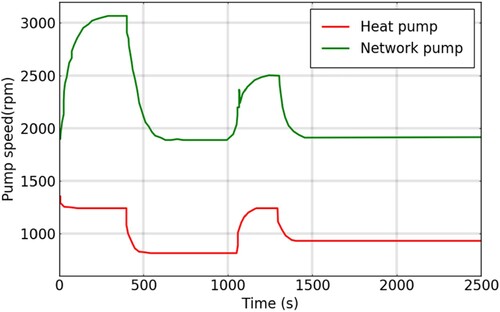
Figure 7. C →D: Control signal for HP evaporator side. DT before and after heat-pump is 7 K.
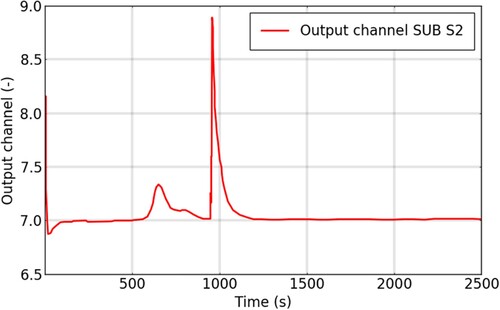
Figure 8. C →D: Pump rotational speed controlled (HP inlet side).
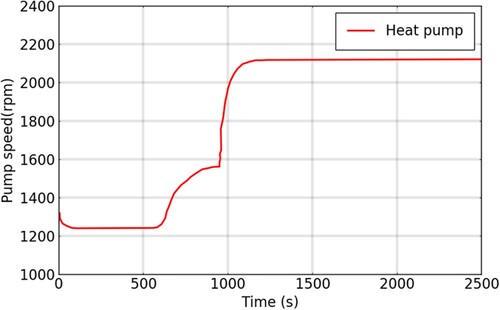
Figure 9. E →F: House heat demand in kW (bottom green line) and heat supply PVT (top red line).
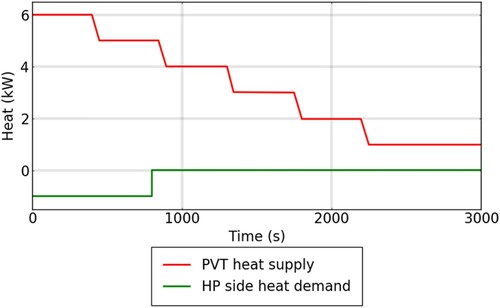
Figure 10. E →F: Temperature at the outlet of PVT. Setpoint is adjusted at 20°C.
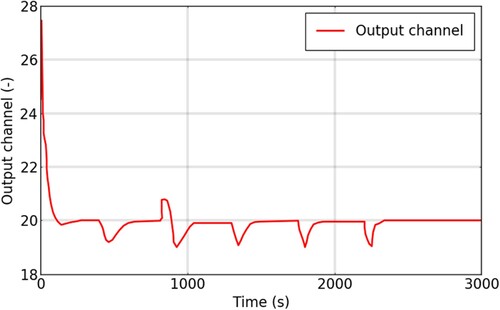
Figure 11. E → F: Temperature difference at the two network sides. Setpoint adjusted at DT = 7 K.
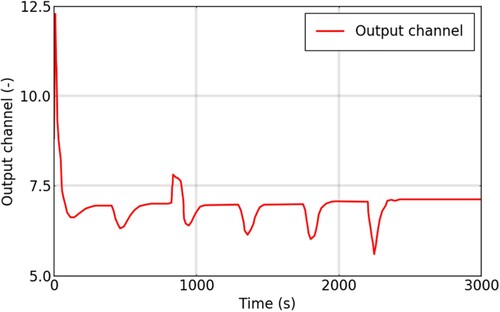
Figure 12. E →F: Pump rotational speed controlled (Top green line: the network pump speed and bottom red line: the PVT pump).
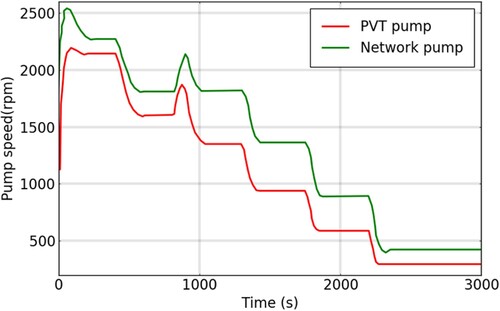
Figure 13. E →D: House heat demand in W (bottom green line) and heat supply PVT (top red line).
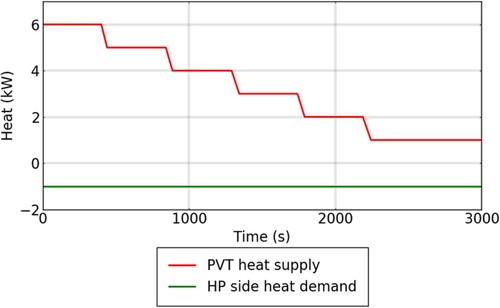
Figure 14. E → D: Pump rotational speed controlled (Top blue line: PVT pump, middle red line: HP evaporator, botom green line: network pump).
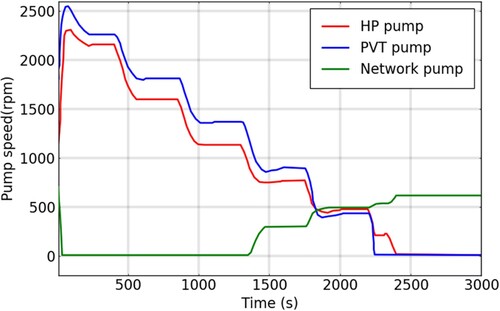
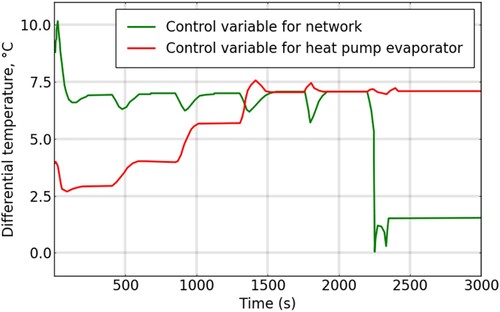
Figure 15. E → D: Control variable for network (top green line) and evaporator (bottom red line). DT before and after HP is 7 K.