Figures & data
Figure 1. Model overview, showing e.g. The interconnections between the three sub-models.
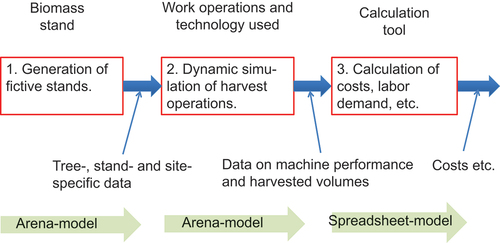
Figure 2. Input data, model logic and output data for the stand generator (RNG – random number generator, DM – dry matter, DBH – diameter at breast height).
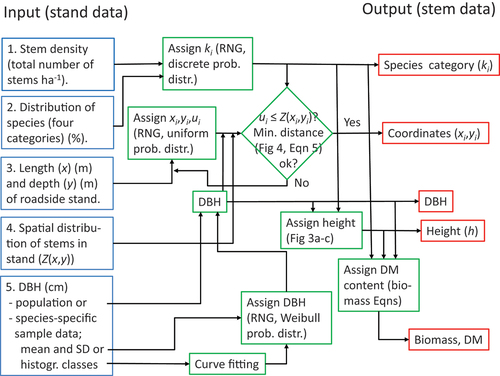
Figure 3. Height of scots pine (upper left), Norway spruce (upper right) and birch (lower) trees with DBH as independent variable. The markers indicate the arithmetic mean in each DBH class (0–2 cm, 2–4 cm, etc.), the bars indicate minimum and maximum values observed (total number of observations n = 396, n = 469 and n = 233, respectively) and the values of R2 refer to the curve fitting of arithmetic means (data from Marklund Citation1988).
Figure 4. Minimum distances between coniferous trees (Dc-c), coniferous and deciduous trees (Dc-d) (or vice versa (Dd-c)) and deciduous trees (Dd-d) used in the stand generator. The marks show the 1-percentile stem-to-stem distances of totally around 5000 larch and beech trees (data from Pretzsch (Citation1997)).
Figure 5. Flowchart for harvester operations.
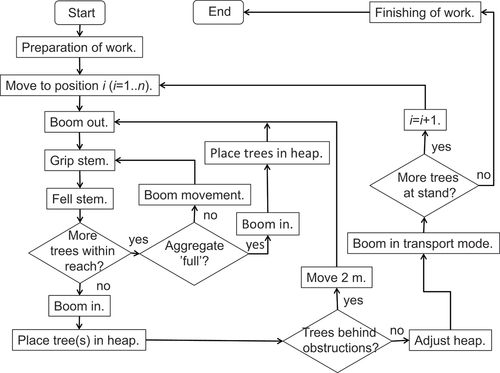
Figure 6. Machine and boom movements.
Figure 7. Visualization in Heureka of stand types 4.0/3.0/25 (left) and 7.0/4.0/150 (right), with a total dry matter content in stems and branches of 134 kg and 2361 kg, respectively (table 1).
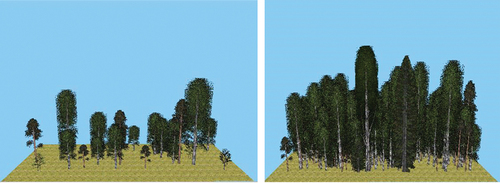
Table 1. Characteristics for the 29 stand types (25 m × 5 m) generated. The stands can be identified by the three parameters p1/p2/p3, where p1 is targeted average DBH (cm), p2 targeted standard deviation of DBH (cm) and p3 targeted number of stems in hundreds per hectare (100 ha−1.).
Figure 8. Simulated and observed (Iwarsson Wide Citation2009b) number of stems in the boom cycles.
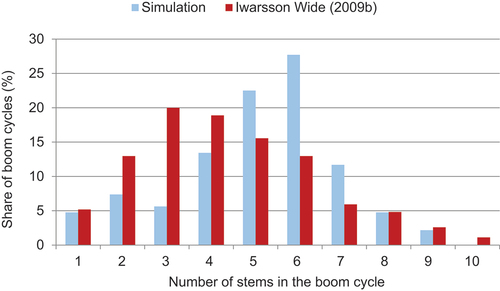
Table 2. Simulated and observed (Iwarsson Wide Citation2009b) stand and harvest performance data.
Table 3. Simulated and observed (Edlund Citation2009) performance data for clearing of brushwood at a roadside (150 m x 2.5 m) near Örnsköldsvik in Sweden.
Figure 9. Productive time (PMh per 25 m) required for the different tasks when harvesting the stands investigated.
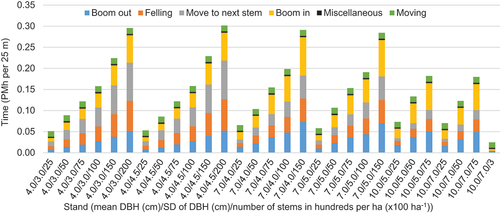
Figure 10. Number of boom cycles, broken down by number of stems in each cycle, for four stands with the same stem density (15,000 stems ha−1).
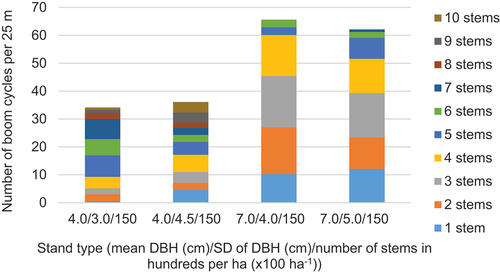
Figure 11. Productivity (in tonnes DM per PMh) for the base scenario (upper, left), and change in productivity using a 30% longer boom (upper, right), an increased aggregate volume capacity by 30% (lower, left) and both a 30% longer boom and increased volume capacity (lower, right). The stand types are denoted by: average DBH/standard deviation of DBH.
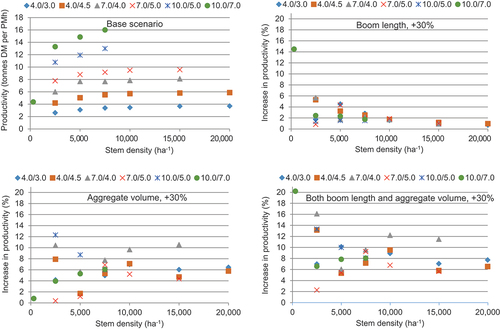
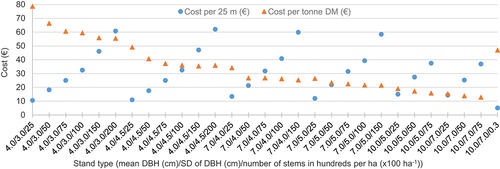
Figure 12. Harvest costs in € per 25 m and in € per tonne of DM for the stands investigated (relocating costs not included).