
Figures & data
Table 1. Sequence of trial blocks for the YA-IAT and the OA-IAT.
Figure 1. Example IAT trial.
Note. Images of older and younger adults are from the Minear and Park (Citation2004) Face Database.
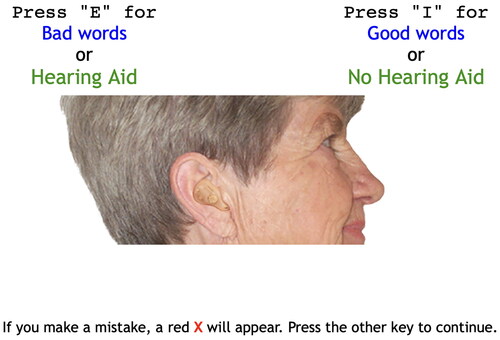
Figure 2. IAT D scores for younger and older participants as a function of YA-IAT and OA-IAT.
Note. Tukey’s box plots represent the median and interquartile range (Q3-Q1). Violin plots represent the probability density of the data across the distribution. Filled circles represent the mean D score for each condition.
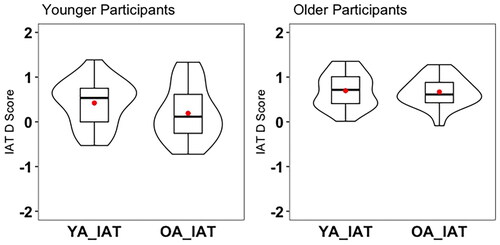
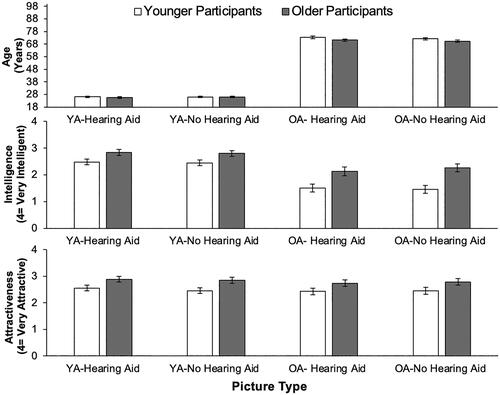
Figure 3. Picture rating results.
Supplemental material
Supplemental Material
Download MS Word (30.5 KB)Data availability statement
The data that support the findings of this study are available from the corresponding author, JB, upon reasonable request.