Figures & data
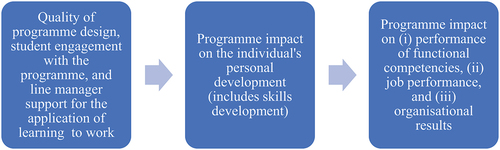
Figure 1. A conceptual framework.
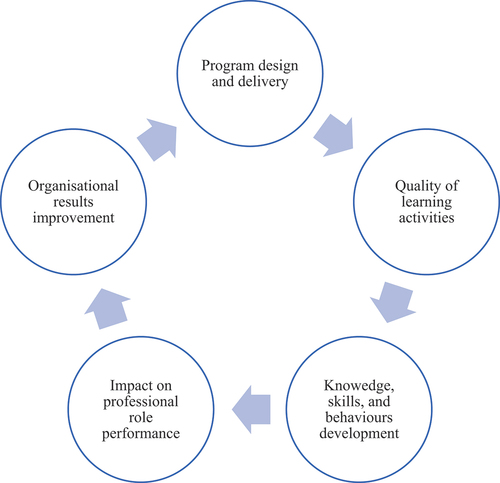
Table 1. Schedule of components for the program.
Table 2. Survey respondents.
Table 3. Bivariate correlations of impact on performance of competencies for current job.
Table 4. Bivariate correlations of skills.
Table 5. Bivariate correlations relating to the impact of the MPM on organizational Results.
Figure 2. Hypothesised cause-and-effect linkages.

Figure 3. A model of a successful education programme.