Figures & data
Table 1. Overview of scales in the TIMSS 2015 student questionnaire.
Figure 1. Mixture IRT model Framework to Define and Operationalize Random Responders in terms of Independence and Uniformity of Item Responses.Note. Symbols follow standard path diagram conventions, with squares representing observed variables (i.e., item responses); circles, latent variables (i.e., a trait to be measured by the scale of items); arrows indicating dependence relations; vertical lines, response category thresholds. Reprinted under the terms of CC-BY-NC from “Random responders in the TIMSS 2015 student questionnaire: A threat to validity?” by S. van Laar & Braeken, Citation2022, Journal of Educational Measurement.
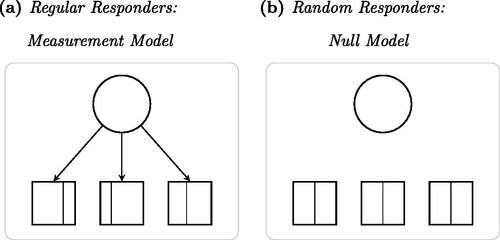
Figure 2. Differences in Prevalence of Random Responders across Countries.Note. The vertical gray line represents the prevalence of random responders for an average country on an average scale under the baseline model (
. The black horizontal lines are 95% confidence intervals of the country-specific deviations in prevalence (ΔPREV(RR)) to that average.
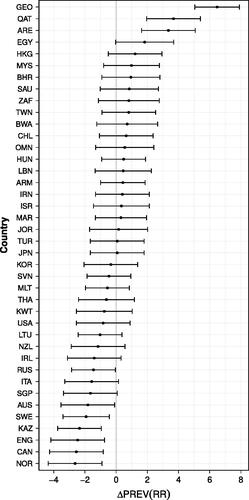
Table 2. Overview of the number of excluded scales: Data collection procedures and/or lack of scale quality.
Table 3. Cross-classified mixed models of the prevalence of random responders as a function of scale position and questionnaire length.
Figure 3. Observed Prevalence of Random Responders per Country across Scales by Science Program .Note. The solid black line represents the observed prevalence of random responders across scales. The dashed grey lines represent the average prevalence on the first and the last scale across countries in the corresponding questionnaire. The spikes in prevalence are related to the confidence scales; within the integrated science questionnaire located at position 4 and 8 and within the separated science questionnaire located at position 4, 8, 11, 14, and 17 (i.e., indicated by the grey vertical bars).
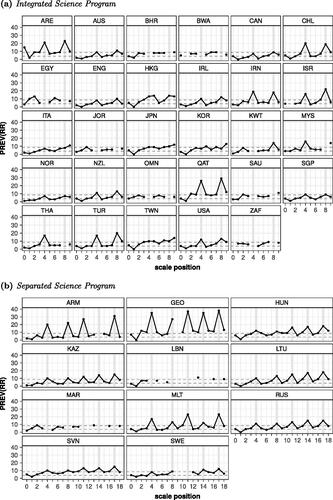
Table 4. Revisited with confidence in mind: Cross-classified mixed models of the prevalence of random responders as a function of scale position and questionnaire length.
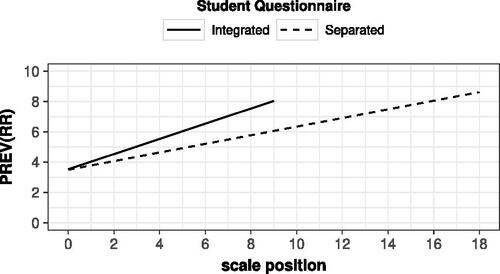
Figure 4. Prevalence of random responders as a function of scale position and questionnaire length in TIMSS 2015 under the cross-classified mixed model .Note. The TIMSS 2015 student questionnaire consisted of 10 survey scales for countries with an integrated science program, whereas it consisted of 19 survey scales for countries with a separated science program. For the model parameters of model
, see .