Figures & data
Figure 1. Cigarette smoke extract (CSE) transiently induced the transcriptional activity of FOXO3 and activated PINK1–Parkin-mediated mitophagy in HBECs. (A) Immunostaining of endogenous FOXO3 (performed without upregulation) revealed abundant nuclear FOXO3 (red) expression in cells treated with 1% CSE for 36 h. (B) Exposure of primary culture of bronchial epithelial cells isolated from 3-week-old wild-type mice to 1% CSE for 36 h did not result in changes in the levels of FOXO3 mRNA as determined via real-time RT-PCR. Cells were isolated from 6 mice, and experiments were performed in duplicate. (C) Expression level of endogenous FOXO3 and SIRT1 protein was elevated in primary cultures after exposure to 1% CSE; however, Ac-FOXO3 protein levels were decreased (n = 6 with duplicates). Cells without exposure to 1% CSE served as the control group (*p < 0.05 versus the control group). (D) Increased lung autophagy with a higher LC3II/LC3I ratio in cells treated with 1% CSE. GAPHD was used as the loading control in C and D. DAPI (blue) was used to counterstain the nuclei in A (scale bar = 20 μm). Two-tailed Student’s t-test was performed for A. One-way ANOVA followed by Dunnett’s post hoc test for multiple comparisons was conducted for C and D.
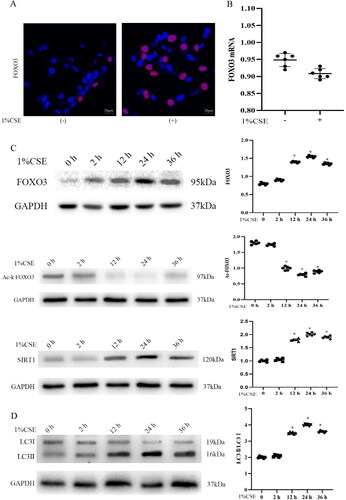
Figure 2. SIRT1 activates FOXO3 and protects against COPD. (A) SIRT1 protein levels were increased during COPD development (n = 4). (B) Elevation in the level of FOXO3 protein caused by exposure to CS was partly dependent on SIRT1 in primary cultures (n = 5 with duplicates) (^^p < 0.01 and *p < 0.05, SIRT1-/- versus SIRT1ctl at 0 and 6 h, respectively). Vehicle-treated mice (SIRT1ctl) served as the control group. (C) Loss of SIRT1 led to an ineffective response to 1% CSE treatment as indicated by an elevation in the mRNA expression level of FOXO3 (n = 3–8 with duplicates) (**p < 0.01 and ***p < 0.001 compared to cells not subjected to 1% CSE treatment n the SIRT1ctl or SIRT1-/- group). (D) Elevation in the nuclear expression of FOXO3 (green) in the alveolar epithelium (LTA in red) of the lungs of SIRT1 Tg mice 6 months after CS exposure (n = 4) (**p < 0.01). (E) SIRT1 loss increased SA-β-gal activity in mice exposed to CS for 6 months; however, the activity was not detected in the lungs of SIRT1 Tg mice. (F) Blots demonstrating reduced FOXO3 protein levels and LC3II/LC3I ratio in the lungs of SIRT1-/- mice compared to those of SIRT1ctl mice (n = 6) (*p < 0.05 and **p < 0.01, SIRT1-/- versus SIRT1ctl) (scale bar = 20 μm for D and 100 μm E). Statistical significance was determined via two-tailed Student’s t-test (B, D, E, and F) and one-way ANOVA followed by Dunnett’s post hoc test for multiple comparisons (C).
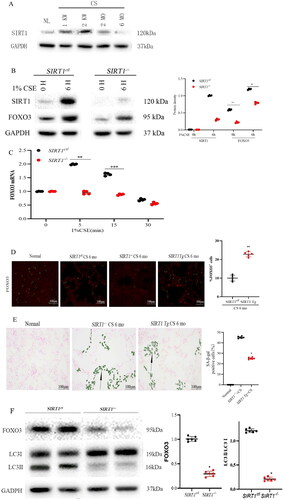
Figure 3. FOXO3 deletion accelerates COPD development. (A) Decrease in FOXO3 protein concentration in lung lysates (n = 6). (B) More severe airway epithelial cell senescence was discovered in FOXO3-/- mice than in FOXO3ctl mice. (SA-β-gal staining, n = 5) (scale bar= 100 μm). (C) Loss of FOXO3 contributed to the enlargement of the airspace caused by CS exposure for 6 months (scale bar = 100 μm). (D) Using anti-p16 and anti-p21 antibodies, western blotting was performed using lung homogenates from healthy mice and mice exposed to CS for 6 months (FOXO3-/-, FOXO3ctl). The data of densitometric analysis of the results of western blotting are averaged (±SEM) and shown in the bottom panel (n = 6). (E) Immunohistochemical staining of p16 and p21 in control mice and mice exposed to CS for 6 months (FOXO3-/-, FOXO3ctl) (scale bar = 100 μm). The proportion (average ± SEM) of airway epithelial cells that were positively stained is shown in the bottom panel (*p < 0.05, FOXO3-/- versus FOXO3ctl). Statistical significance was assessed via a two-tailed Student’s t-test (A–E).
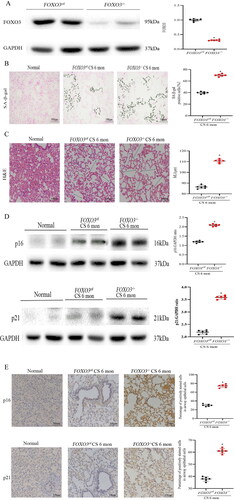
Figure 4. FOXO3 deletion reduces autophagy. (A) EM images depicting autophagosomes (yellow arrows) in airway epithelial cells of FOXO3ctl mice 6 months after CS exposure. (B) Decreased levels of ULK1, Bnip3, LC3II and LC3I proteins were found in the lungs of FOXO3-/- mice (n = 4) (*p < 0.05, FOXO3-/- with FOXO3ctl, two-tailed Student’s t-test). (C) Primary cultures were established using cells isolated from the healthy lungs of 3-week-old FOXO3ctlmice and the lungs of FOXO3-/- mice exposed to 1% CSE for 36 h.FOXO3ctlcells demonstrated a considerable increase in LC3II/LC3I ratio compared to cells exposed to control air (p < 0.05). FOXO3-/- cells had insignificant changes in the LC3II/LC3I ratio (p = 0.31) (n = 6). Two-tailed Student’s t-test was performed for statistical analysis. (D) The autophagy reporter CREL mice were bred with FOXO3ctl and FOXO3-/- mice and exposed to CS as mentioned earlier. FOXO3-/- mice had fewer RFP dots. A considerably higher number of RFP dots was observed in the airway epithelial cells of FOXO3-/- mice (scale bar = 100 μm). (E) RFP dots in primary cultural cells indicated that FOXO3-/- cells contained fewer dots. In comparison, more RFP dots were observed in FOXO3ctl cells (scale bar = 25 μm).
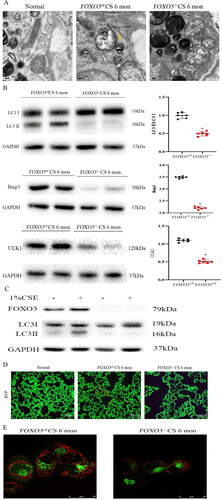
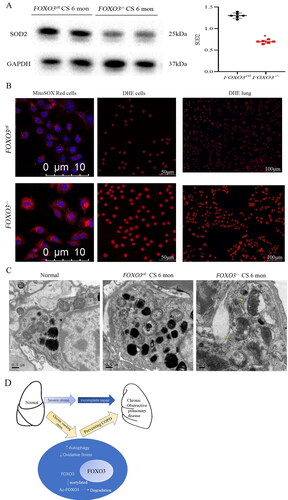
Figure 5. FOXO3 deletion increases CS exposure. (A) The lungs were analysed 6 months after CE exposure. Compared to the lungs of FOXO3ctl mice, the lungs of FOXO3-/-mice had substantially lower levels of the SOD2 protein (n = 6) (*p < 0.05, FOXO3-/-versus FOXO3ctl, two-tailed Student’s t-test). (B) Left and centre panels: Primary cell cultures (FOXO3-/-or FOXO3ctl) were treated with 1% CSE for 1 h and incubated with MitoSOX Red or DHE. The levels of mitochondrial SOD2 measured via MitoSOX Red staining are shown in the left panel, indicating a higher intensity in FOXO3-/- cells. The results of DHE staining (shown in the centre panel) demonstrated that almost all (100%) FOXO3-/- cells produced red nuclear signals, whereas only 49.6% of FOXO3ctl cells generated red nuclear signals. Right panel: After 6 months of CS exposure, DHE staining revealed more pronounced nuclear oxidative stress in the lungs of FOXO3-/- mice. (C) After 6 months of CS exposure, airway epithelial cells exhibited substantial mitochondrial enlargement and loss of cristae as shown in EM images. FOXO3-/-cells had numerous ruptures in both inner and outer membranes of the mitochondria (yellow arrow) (scale bar = 10 μm for the left panel in B; 50 μm for the centre panel in B; 10,050 μm for the right panel in B; 0.5 μm for the left and centre panel in C and 0.2 μm for the right panel in C). D) Mechanistic model for FOXO3 accumulation and autophagy activation to protect lungs.