
Figures & data
Figure 1. Exercise ameliorates COPD induced lung injury by inhibit ROS, inflammation and epithelial-mesenchymal transition (EMT). (A–C) ELISA detection shows the expression of inflammatory factor TNF-α, IL-1β, IL-6. Data are means ± SD. **p < 0.01, ***p < 0.001 vs. control. ##p < 0.01, ###p < 0.001 vs. CS. (D and E) Immunofluorescence detection shows the ROS level in lung tissues. Data are means ± SD. ***p < 0.001 vs. control. ###p < 0.001 vs. CS. (F and G) Representative images of lung sections after Masson trichrome staining. Data are expressed as mean ± SD. ***p < 0.001 vs. control. ##p < 0.01, ###p < 0.001 vs. CS. (H and I) Representative images and quantification of the α-SMA expression in the lung tissue samples in different groups. Data are expressed as mean ± SD. **p < 0.01, ***p < 0.001 vs. control. ###p < 0.001 vs. CS.
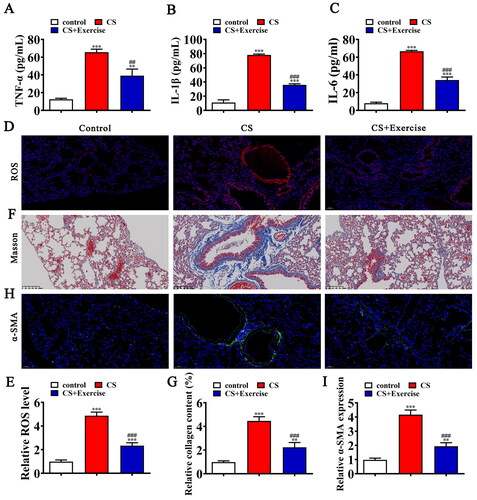
Figure 2. Downregulation lnc-H19 inhibits COPD mediated lung injury. (A) RT-qPCR detection shows the expression of lnc-H19 among normal, CS, and CS + Exercise mice serum. Data are means ± SD. **p < 0.01 vs. control. ##p < 0.01 vs. CS. (B) RT-qPCR detection shows the expression of lnc-H19 in BECs. Data are means ± SD. ***p < 0.001 vs. NC. ###p < 0.001 vs. CSE. (C–E) ELISA detection shows the expression of inflammatory factor TNF-α, IL-1β, IL-6. Data are means ± SD. **p < 0.01, ***p < 0.001 vs. NC. ###p < 0.001 vs. CSE. (F and G) Immunofluorescence detection shows the ROS level in lung tissues. Data are means ± SD. ***p < 0.001 vs. NC. ###p < 0.001 vs. CSE. (H and I) Representative images and quantification of the α-SMA expression in the skin tissue samples in different groups. Data are means ± SD. **p < 0.01, ***p < 0.001 vs. NC. ###p < 0.001 vs. CSE.
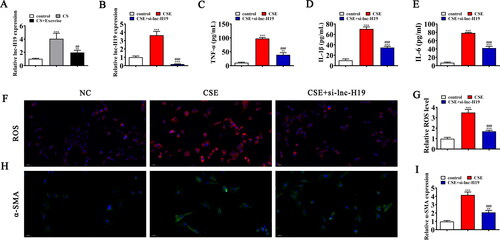
Figure 3. miR-181 and PDCD4 were downstream targets of lnc-H19. (A) Bioinformatics analysis predicting binding sites of miR-181 in lnc-H19. Mutant version of lnc-H19 is shown. (B) Relative luciferase activity determined 48 hours after transfection of BECs cells with miR-181 mimic/NC or lnc-H19 wild-type/Mut. Data are means ± SD. ***p < 0.01. (C) Prediction of miR-181 binding sites in the 3′-UTR of PDCD4. Mutant version of 3′-UTR-PDCD4 is shown. (D) Relative luciferase activity 48 hours after transfection of BECs with miR-181 mimic/NC or 3′-UTR-PDCD4 wild-type/Mut. Data are means ± SD. ***p < 0.01.
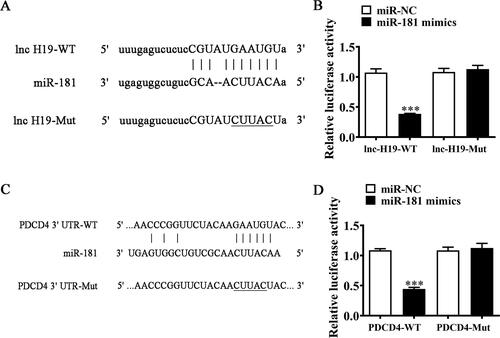
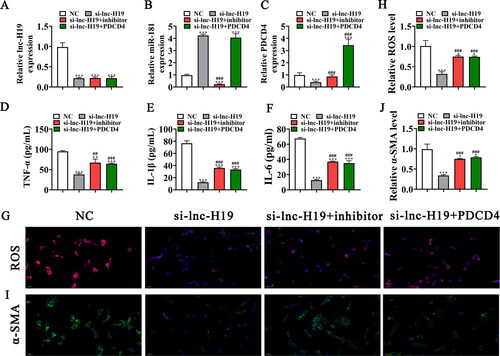
Figure 4. Upregulation of PDCD4 or downregulation of miR-181 reversed the protective effect of si-lnc-H19 to BECs after exposure to CSE. (A–C) RT-qPCR detection shows the expression of lnc-H19, miR-181, and PDCD4 in BECs. Data are means ± SD. ***p < 0.001 vs. NC. ###p < 0.001 vs si-lnc-H19. (D-F) ELISA detection shows the expression of inflammatory factor TNF-α, IL-1β, IL-6. Data are means ± SD. **p < 0.01, ***p < 0.001 vs. NC. ##p < 0.01, ###p < 0.001 vs si-lnc-H19. (G and H) Immunofluorescence detection shows the ROS level in BECs. Data are means ± SD. *p < 0.05, ***p < 0.001 vs. NC. ###p < 0.001 vs si-lnc-H19. (I and J) Representative images and quantification of the α-SMA expression in the BECs in different groups. Data are means ± SD. *p < 0.05, ***p < 0.001 vs. NC. ###p < 0.001 vs si-lnc-H19.
Data availability
The datasets used and/or analyzed during the current study are available from the corresponding author on reasonable request.