Figures & data
Table 1. Summary of Studies Included in the Depression Meta-Analysis.
Table 2. Summary of Studies Included in the Anxiety Meta-Analysis.
Figure 1. Study flow-diagram.
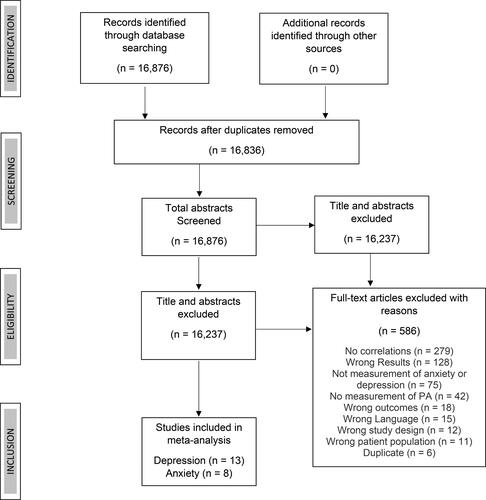
Figure 2. Funnel plot for depression and physical activity meta-analysis. Approximate symmetry suggests no bias is present.
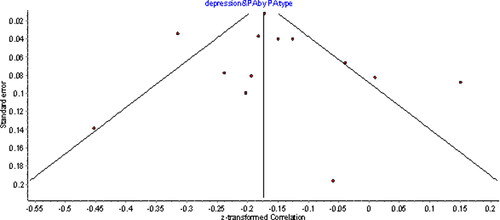
Figure 3. Individual study and pooled results of the relationship between depression and physical activity presented by physical activity measurement type (self-report or objective).
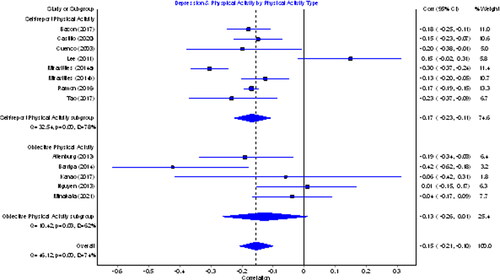
Figure 4. Funnel plot for anxiety and physical activity meta-analysis. Approximate symmetry suggests no bias is present.
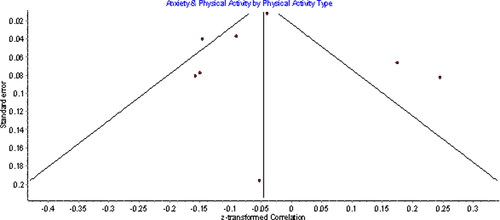
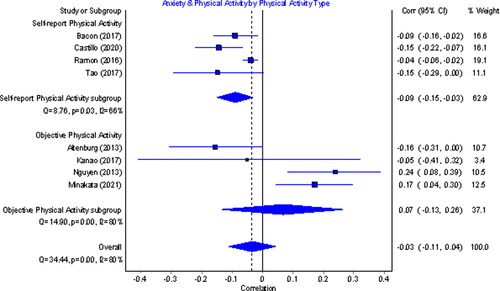
Figure 5. Individual study and pooled results of the relationship between anxiety and physical activity presented by physical activity measurement type (self-report or objective).