
Figures & data
Figure 1. The flow chart shows the selection protocol of the study participants.
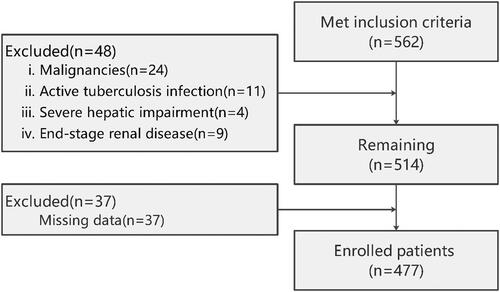
Figure 2. Distribution of the serum cholinesterase levels in patients with AECOPD. Abbreviations: ChE, cholinesterase; IQR, interquartile range.
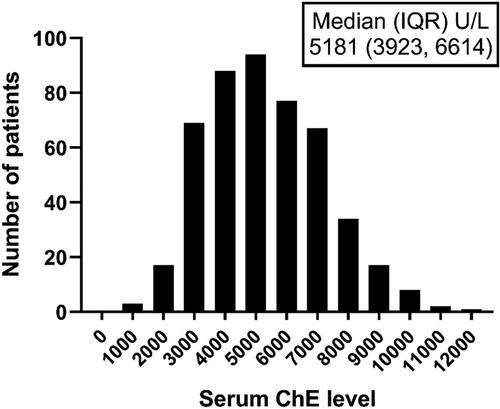
Table 1. Baseline characteristics of hospitalized survival and non-survivals groups of AECOPD patients.
Figure 3. ROC curve analysis of the clinical value of serum cholinesterase levels in predicting the in-hospital mortality of patients with AECOPD. Abbreviations: ROC, receiver operating characteristic; AUC, area under the ROC curve; CI, confidence interval.
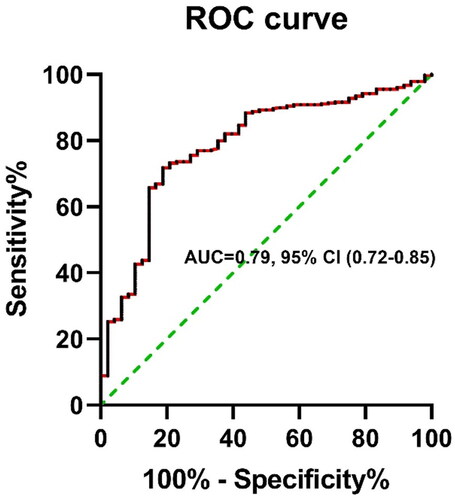
Table 2. Patient characteristics stratified by the serum cholinesterase levels.
Figure 4. Calibration curve of the multivariate logistic regression model. As shown, the calibration curve demonstrates satisfactory goodness of fit for the multivariate logistic regression model.
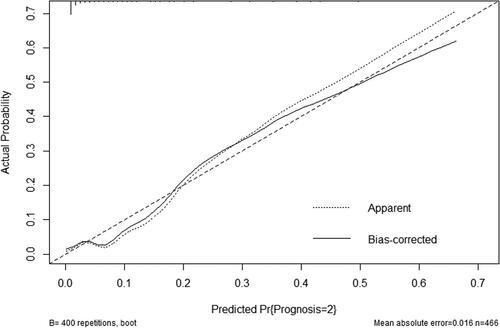
Table 3. Univariate and multivariate logistic regression analyses of potential risk factors associated with the in-hospital mortality of AECOPD patients.
Supplemental Material
Download PDF (290.3 KB)Data availability statement
The data that support the findings of this study are available on request from the corresponding author, Zhixiang Chen.