Figures & data
Figure 1. CONSORT diagram of patient enrollment into the study.
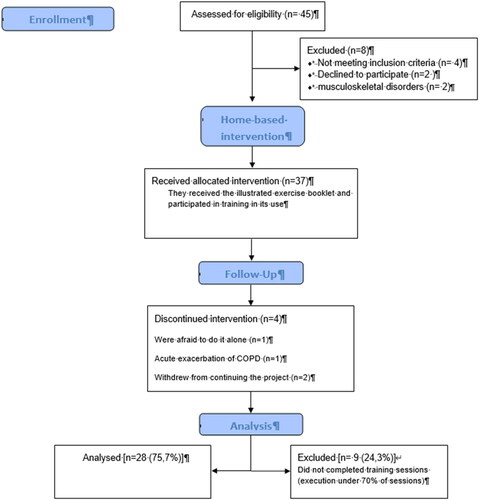
Table 1. Demographic data of the sample at the time of the initial assessment.
Table 2. The difference in ADL- Glittre time, CAT, and mMRC pre and post-intervention.
Table 3. Comparative analysis between the means of variation of time after intervention (min) of the ADL- Glittre time and the score of the COPD Assessment test (CAT) among COPD individuals with different severity profiles.
Table 4. Quality of life analysis by the SGRQ and its subdomains before and after the intervention.
Figure 2. Comparative analysis of the intervention in the duration of the ADL-Glittre in COPD individuals with different GOLD classification criteria. *Statistically significant compared to baseline (adjusted p – value = 0.012) Adjusted p- value for the false discovery rate (FDR method. **Statistically significant compared to baseline (adjusted p – value = 0.002) Adjusted p- value for the false discovery rate (FDR method).
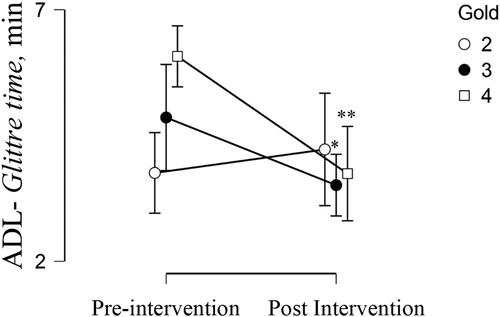
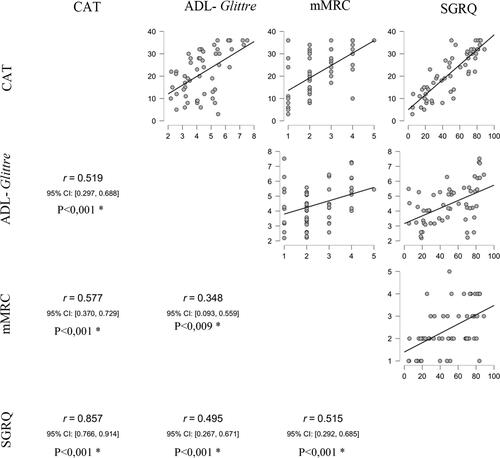
Figure 3. Correlation matrix (pearson’s correlation) between the mean variation (pre and post-intervention) in the time to perform the ADL-Glittre test, min, in the COPD assessment test (CAT), in the Medical resource Council modified dyspnea scale (mMRC), and the Saint George’s Hospital questionnaire on respiratory disease (SGRQ). r = Pearson’s correlation coefficient, CI: 95% confidence interval. * statistically significant correlation. Adjusted p- value for the false discovery rate (FDR method