
Figures & data
Figure 1. Flow diagram illustrating the study selection process.
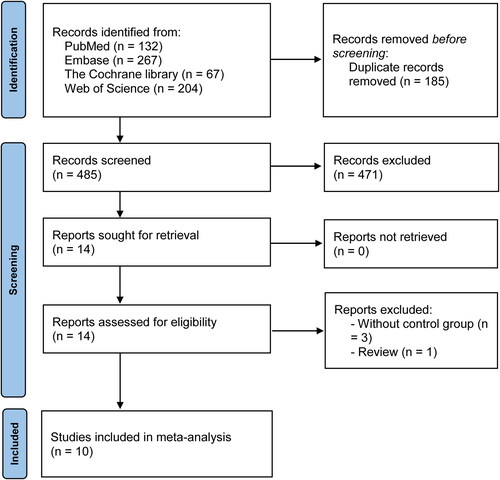
Table 1. Characteristics of the included studies in this meta-analysis.
Table 2. Outcomes of the sensitivity analysis and test of publication bias.
Figure 2. Forest plots comparing exacerbations (A) and hospitalizations (B) between the budesonide/formoterol and fluticasone/salmeterol groups.
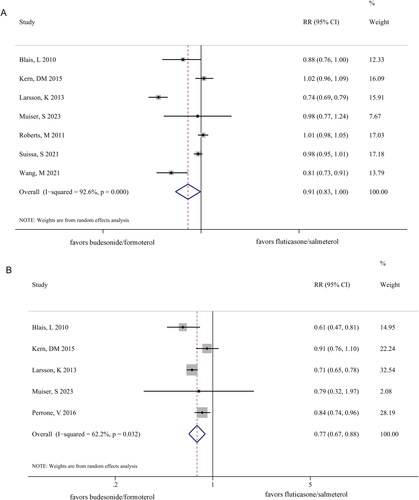
Figure 3. Forest plots comparing pneumonia (A) and emergency department visits for chronic obstructive pulmonary disease (B) between the budesonide/formoterol and fluticasone/salmeterol groups.
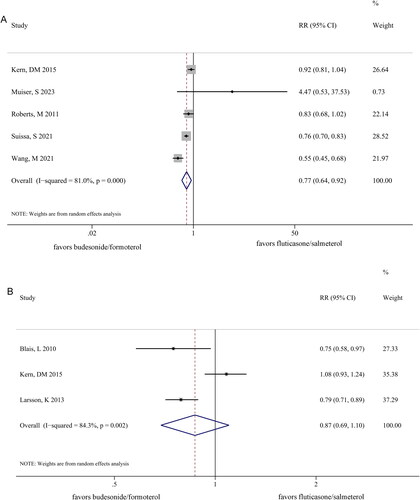
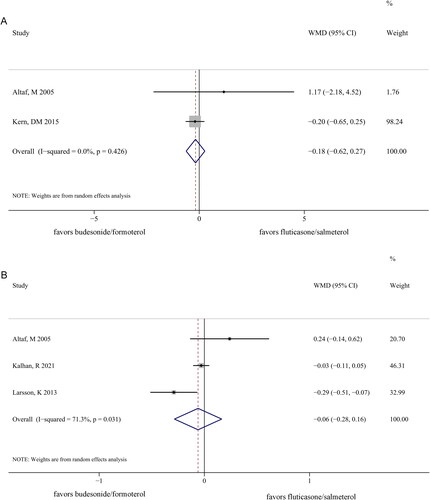
Figure 4. Forest plots comparing the length of hospitalization (A) and number of exacerbations (B) between the budesonide/formoterol and fluticasone/salmeterol groups.
Supplemental Material
Download TIFF Image (36.9 MB)Data availability statement
The data analyzed in this study was available from the corresponding author upon reasonable request.