
Figures & data
Figure 1. Commodity prices (rebased Sep-92 = 100).
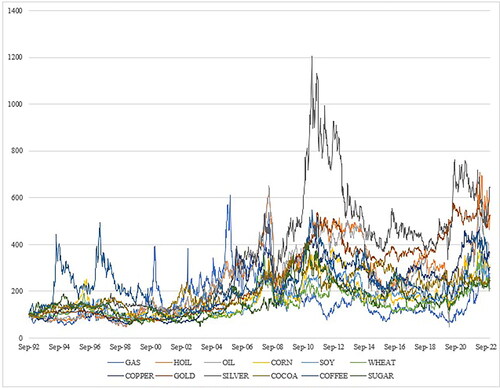
Table 1. Descriptive statistics.
Figure 2. Outright positions by trader type.
Note: This figure illustrates the outright long and short positions for commercial (COM) and non-commercial (NCOM) traders. Panel A averages the positions for energy futures (GAS, HOIL, OIL), Panel B for grain futures (CORN, SOY, WHEAT), Panel C for metal futures (COPPER, GOLD, SILVER), and Panel D for softs futures (COCOA, COFFEE, SUGAR). NB: Energy futures are scaled by 103 to ease readability.
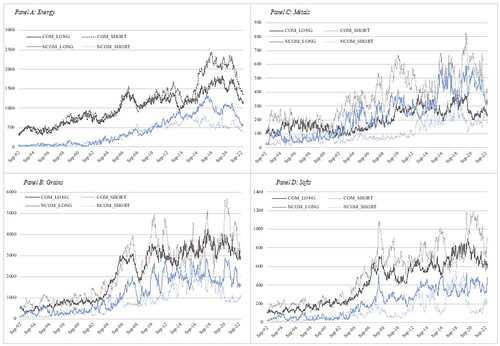
Figure 3. Net positions by trader type.
Note: This figure illustrates the net positions for commercial (COM) and non-commercial (NCOM) traders. Panel A averages the positions for energy futures (GAS, HOIL, OIL), Panel B for grain futures (CORN, SOY, WHEAT), Panel C for metal futures (COPPER, GOLD, SILVER), and Panel D for softs futures (COCOA, COFFEE, SUGAR).
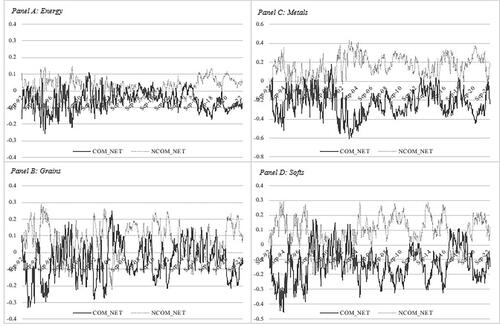
Table 2. Regression: influence of 52-week highs and lows on trading behavior of commercial traders.
Table 3. Regression: influence of 52-week highs and lows on trading behavior of noncommercial traders.
Table 4. Granger causality tests.
Table 5. Importance of market condition (Backwardation & Contango).
Table 6. Commercial traders outright longs and shorts.
Table 7. Noncommercial traders outright long and shorts.
Table 8. Market timing.
Data availability statement
The data that supports the findings of this study has been obtained from two different sources: (a) data for futures returns and futures market/macroeconomic control variables is obtained from DataStream; and (b) Commitment of Traders data used to construct net positions is obtained from the Commodity Futures Trading Commission. The first set of data is available only on license from Refinitiv, the second is accessible at https://www.cftc.gov/MarketReports/CommitmentsofTraders/index.htm