1,861
Views
0
CrossRef citations to date
0
Altmetric
Research Article

Cumulative effects of subsequent concussions on the neural patterns of young rugby athletes: data from event-related potentials

ORCID Icon, &
Received 16 Dec 2021, Accepted 01 Mar 2023, Published online: 15 Mar 2023

Figures & data

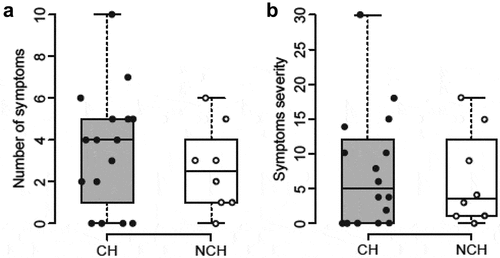
Figure 1. Number of symptoms (a) and symptom severity score (b) according to concussion history.

Figure 1. Number of symptoms (a) and symptom severity score (b) according to concussion history.

Table 1. Age, SCAT2 results and ERP (P3b) parameters according to the concussion history of the athletes.

Figure 2. Grand average ERPs to target stimuli recorded in concussion history group (a) and in group without history of concussion (b). Amplitude, in µv, is represented along Y-axis while latency is along the X-axis and in ms. ERPS are represented with the N1 exogenous followed by endogenous responses: N2, P3a and P3b. (c) P3b amplitude according to recording site and concussion history. (d) ROC/AUC analysis of the ability of P3b amplitudes to discriminate athletes with a history of concussion from without.
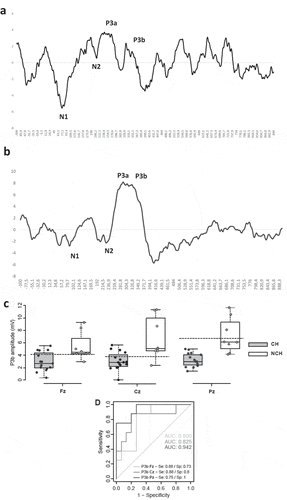
Figure 2. Grand average ERPs to target stimuli recorded in concussion history group (a) and in group without history of concussion (b). Amplitude, in µv, is represented along Y-axis while latency is along the X-axis and in ms. ERPS are represented with the N1 exogenous followed by endogenous responses: N2, P3a and P3b. (c) P3b amplitude according to recording site and concussion history. (d) ROC/AUC analysis of the ability of P3b amplitudes to discriminate athletes with a history of concussion from without.

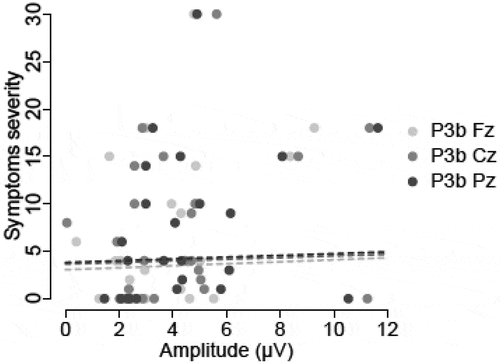
Figure 3. Scatter plot of symptom severity and ERP P3b amplitude.

Figure 3. Scatter plot of symptom severity and ERP P3b amplitude.

Table 2. Correlation between endorsed symptoms and ERP parameters.