651
Views
0
CrossRef citations to date
0
Altmetric
Research Article

The combined effectiveness of therapeutic ultrasound, electrical stimulations, and blood flow restriction to treat symptoms of muscle damage

, & ORCID Icon
Received 01 Aug 2023, Accepted 16 Feb 2024, Published online: 28 Feb 2024

Figures & data

Figure 1. Study overview.

Figure 1. Study overview.

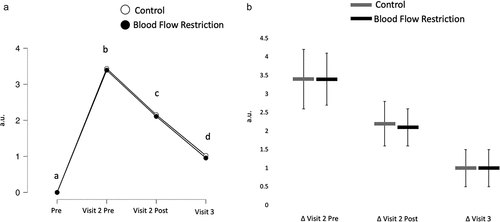
Figure 2. Discomfort.

Letters indicate a significant time effect, whereby time-points containing the same letter are not different than one another. Notably, each time-point is different from one another. Differences were determined as having Bayes Factor ≥3. a) means for discomfort at each time-point; b) change scores from pre and 95% credible intervals. The pre-value was taken before the damaging exercise, the visit 2 pre was taken 48 h after the damaging exercise, the visit 2 post was taken 5-min after the treatment protocols (approximately 30-min after the visit 2 pre), and the visit 3 was taken 24 h after the treatment protocols.
Figure 2. Discomfort.

Figure 3. Relaxed joint angle.
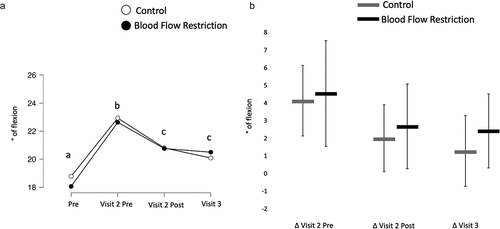
Letters indicate a significant time effect, whereby time-points containing the same letter are not different than one another. Notably, all time-points are significantly different from one another except for the visit 2 post and visit 3 time points. Differences were determined as having Bayes Factor ≥3. a) means for relaxed joint angle at each time-point; b) change scores from pre and 95% credible intervals. The pre-value was taken before the damaging exercise, the visit 2 pre was taken 48 h after the damaging exercise, the visit 2 post was taken 5-min after the treatment protocols (approximately 30-min after the visit 2 pre), and the visit 3 was taken 24 h after the treatment protocols.
Figure 3. Relaxed joint angle.

Figure 4. Muscle thickness.
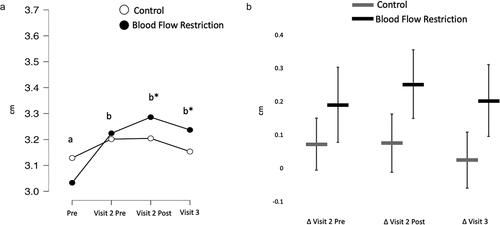
Letters indicate a significant time effect, whereby time-points containing the same letter are not different than one another. * denotes a difference in the change from pre-value across conditions. Differences were determined as having Bayes Factor ≥3. a) means for muscle thickness at each time-point; b) change scores from pre and 95% credible intervals. The pre-value was taken before the damaging exercise, the visit 2 pre was taken 48 h after the damaging exercise, the visit 2 post was taken 5-min after the treatment protocols (approximately 30-min after the visit 2 pre), and the visit 3 was taken 24 h after the treatment protocols.
Figure 4. Muscle thickness.

Figure 5. Pain-pressure threshold.
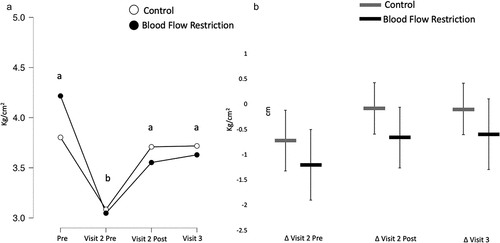
Letters indicate a significant time effect, whereby time-points containing the same letter are not different than one another. Notably, only the visit 2 pre was different than all other time points. Differences were determined as having Bayes Factor ≥3. a) means for pain-pressure threshold at each time-point; b) change scores from pre and 95% credible intervals. The pre-value was taken before the damaging exercise, the visit 2 pre was taken 48 h after the damaging exercise, the visit 2 post was taken 5-min after the treatment protocols (approximately 30-min after the visit 2 pre), and the visit 3 was taken 24 h after the treatment protocols.
Figure 5. Pain-pressure threshold.

Figure 6. Isometric strength.
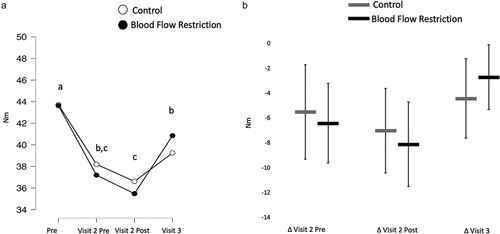
Letters indicate a significant time effect, whereby time-points containing the same letter are not different than one another. Differences were determined as having Bayes Factor ≥3. a) means for isometric strength at each time-point; b) change scores from pre and 95% credible intervals. The pre-value was taken before the damaging exercise, the visit 2 pre was taken 48 h after the damaging exercise, the visit 2 post was taken 5-min after the treatment protocols (approximately 30-min after the visit 2 pre), and the visit 3 was taken 24 h after the treatment protocols.
Figure 6. Isometric strength.

Data availability statement

Data are available upon request of the corresponding author.