
Figures & data
Figure 1. The sustainability star: a model of the sustainability of cultural organizations.
Note: The model consists of three spheres: the governance sphere (grey), with four strategic dimensions for embedding sustainability in cultural organizations; the social sphere (yellow), with eight social dimensions; the environmental sphere (blue), with eight environmental dimensions. Together with a scoring system, the model represents the progress of a cultural organization, or the whole sector, toward sustainability: the closer the scores to the white ring, the higher the sustainability.
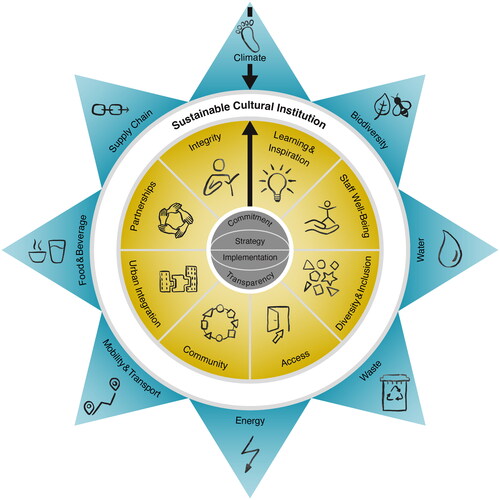
Figure 2. Sustainability benchmark of cultural organizations according to the sustainability star model.
Note: Scores for all organizations in the sample combined (N = 206). Note the low score of the environmental sphere. Box plots showing distributions are in Figures S2 and S3 in the supplemental material.
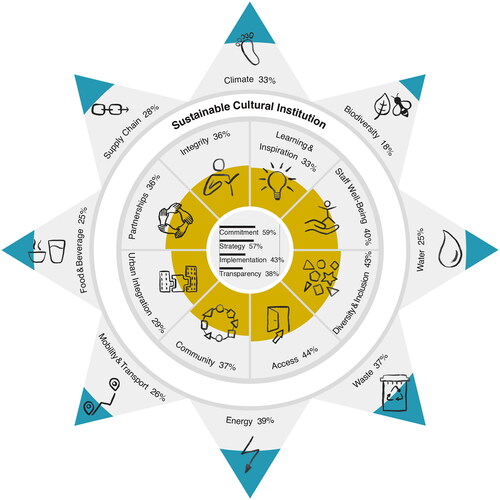
Figure 3. Scatterplot of social vs environmental sustainability scores of cultural organizations in the sample, with regression line (N = 206).
Note: Names of organizations ranking above 70 for both the social and environmental sphere are revealed with their approval. Note the concentration in the bottom-left quadrant and the relative absence in the “environmental champions” quadrant. High environmental scores are typically related with high social scores. Of the 14 organizations with social and environmental scores above 70, six are in the UK. Table S6 (supplemental material) provides full details.
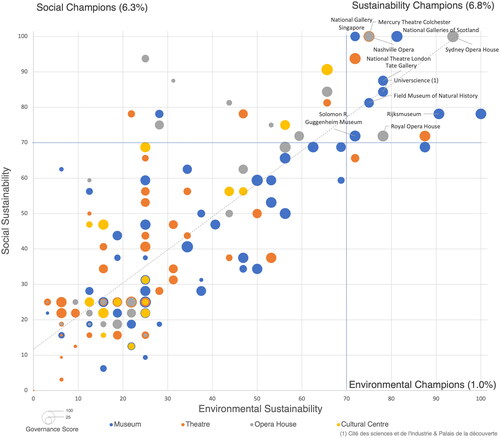
Figure 4. Sustainability scores by world region (N = 206).
Note: Differences between individual world regions are not statistically significant, due to the significant variance of scores within regions and the small number of cases (n < 10) of several regions. The strong presence of organizations from Europe and North America in the sample is a result of their greater number among the universe of organizations contacted and their above-average response rates (see supplemental material).
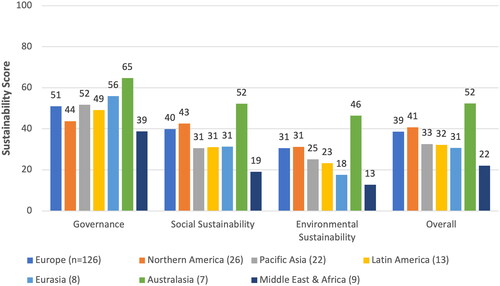
Table 1. Regression models for sustainability scores.
Table 2. Best practices of cultural organizations identified in semi-structured interviews.
SSPP_Methods Appendix_20240115_Unlink.docx
Download MS Word (741.5 KB)Data availability statement
The datasets and statistical outputs are posted on Harvard dataverse (see citations in the reference list). Interview transcripts can be shared upon reasonable request.