
Figures & data
Table 1. Descriptive statistics.
Table 2. Descriptive statistics and correlations for study variables.
Table 3. Model fit indices (BIC and AIC) for different cluster solutions.
Table 4. Entropy for the different cluster models and news belief variables.
Figure 1. Cluster profile means of ‘fake news believer’ profiles on radar and bar chart.
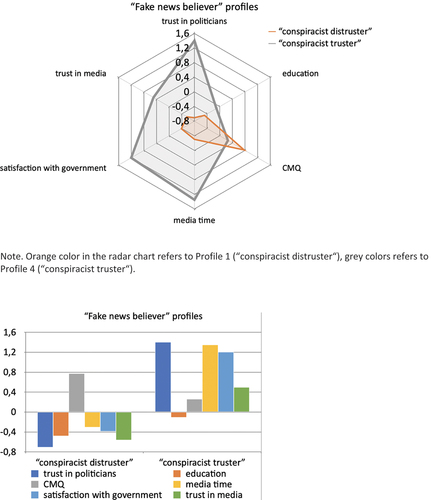
Figure 2. Cluster profile means of ‘fake news nonbeliever’ profiles on radar and bar chart.
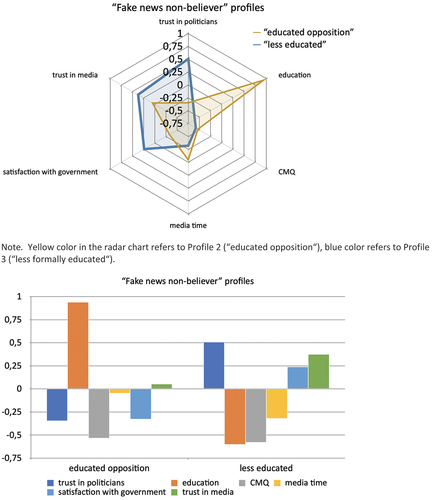
Figure 3. News belief map of profiles with higher overall fake news belief on radar and bar chart.
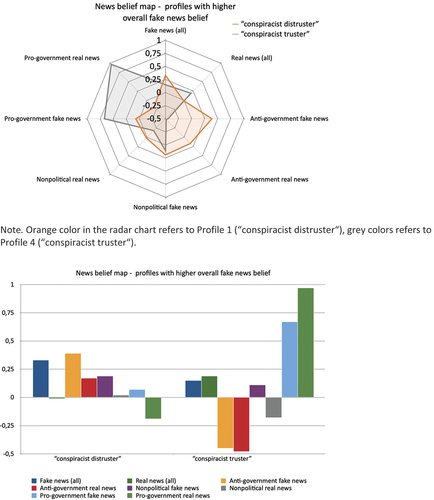
Figure 4. News belief map of profiles with lower overall fake news belief on radar and bar chart.
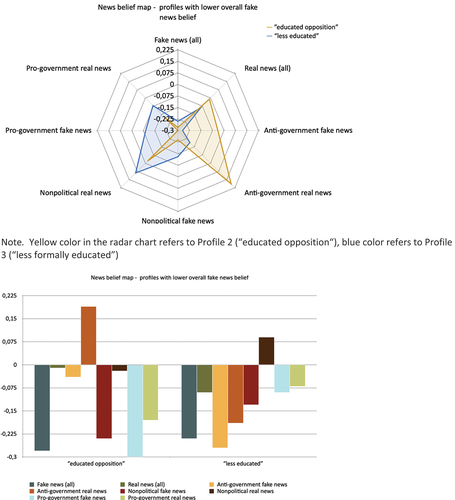
Table 5. Cluster centroids (standardized) and demographics of cluster profiles.
Table 6. Descriptive statistics of the four cluster profiles in terms of news belief (standardized).
Table 7. Highest education of profiles in our study and the national average (KSH, Citation2016).
Table 8. One-way analyses of variance between groups in news belief items.
Table 9. Results for Bonferroni’s multiple comparisons between different clusters in terms of news belief.
Data availability statement
The data that support the findings of this study and the supplementary materials are openly available in OSF at https://doi.org/10.17605/OSF.IO/QSKFM