
Figures & data
Figure 1. Comparison of patient age between the sedative and non-sedative groups.
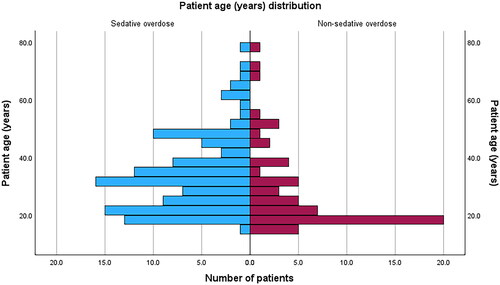
Table 1. Characteristics of the sedative and non-sedative groups.
Figure 2. Scatter plot demonstrating Trail Making Test part A time for patients with sedative versus non-sedative overdose. Horizontal bars represent the median and interquartile range for each group.
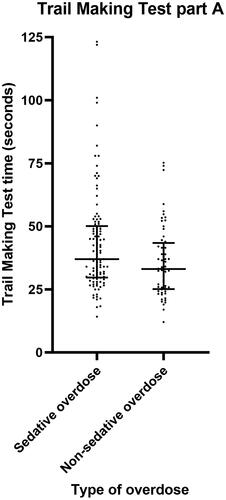
Figure 3. Scatter plot demonstrating Trail Making Test part B time for patients with sedative versus non-sedative overdose. Horizontal bars represent the median and interquartile range for each group.
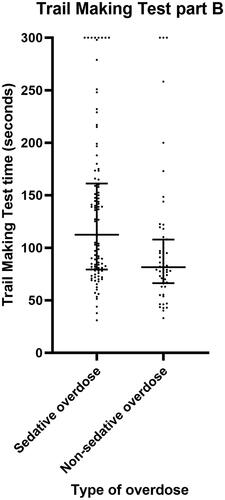
Table 2. Comparison of trail making test parts A and B, and duration of admission, between the sedative and non-sedative groups.
Table 3. Comparison of Trail Making Test parts A and B between those whose overdose included benzodiazepines or did not, within the sedative group.
Table 4. Final regression models of sedative versus non-sedative overdose for trail Making Test part B time. Model created using multiple linear regression refined by backwards elimination method with missing data treated pairwise.
Data availability statement
The participants of this study did not give written consent for their data to be shared publicly, so due to the sensitive nature of the research supporting data is not available.