
Figures & data
Figure 1. (a). Real time setup of experimental setup. (b). Orientation of thermocouples mounted on the PV panels.
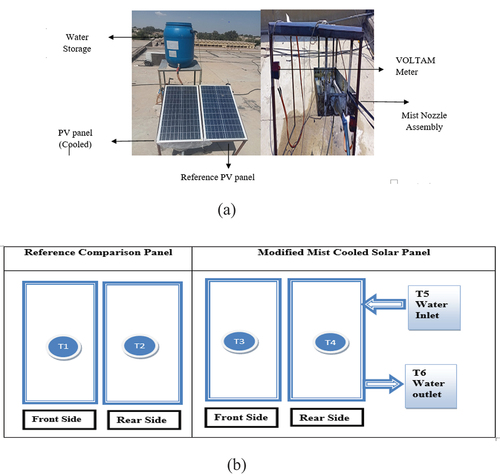
Figure 2. Weather station, data logger and VOLTAM meter.
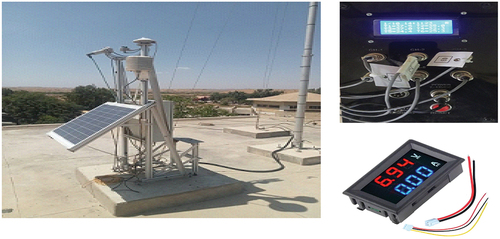
Table 1. Description of polycrystalline silicon PV panel.
Figure 3. Mist nozzle Assembly.
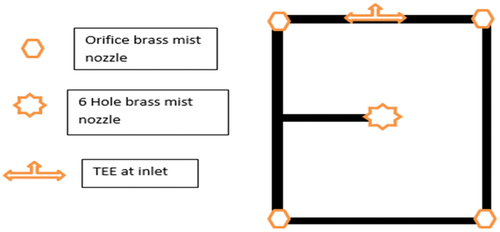
Table 2. Uncertainties associated with the measuring instruments of the experimental setup.
Figure 4. Comparative power and temperature variations of modified and comparison PV modules on 1st, 2nd, and 3rd February.
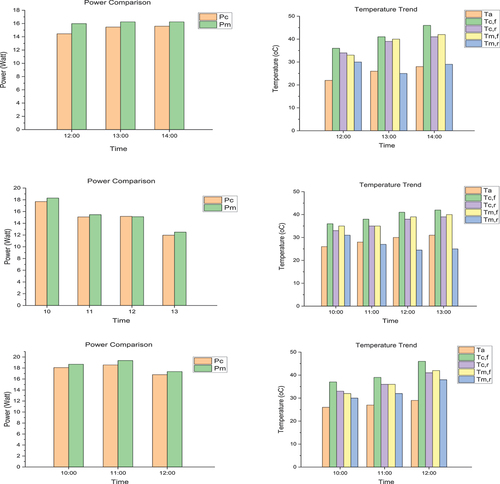
Table 3. Summary of maximum power gain with natural circulation.
Table 4. Summary of PV module temperature variation with natural circulation.
Table 5. Summary of PV module temperature variation with forced circulation.
Table 6. Summary of maximum power gain with forced circulation.
Figure 5a. Comparative power of modified and comparison (Pc & Pm) of PV modules on 8th ,9th, 10th, & 28th February and 1st , & 2nd March.
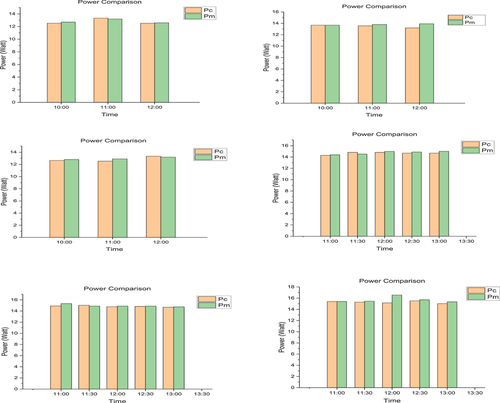
Figure 5b. Temperature trend [ambient, modified and comparison (Ta, Tcf, tcr, tmf, & tmr) on 8th ,9th, 10th, & 28th February and 1st , & 2nd March.
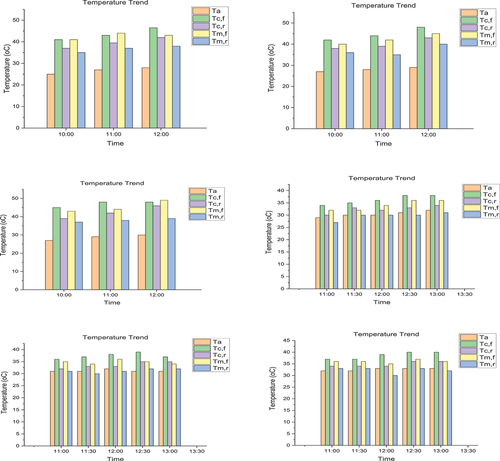
Figure 6. Efficiency comparison and temperature gain on 1st ,2nd , and 3rd February.
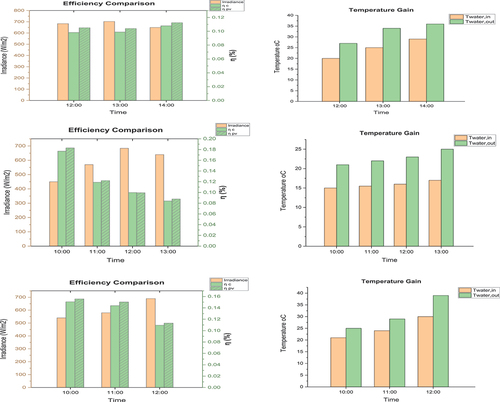
Figure 7a. Efficiency comparison and temperature gain on 8th ,9th , & 10th February.
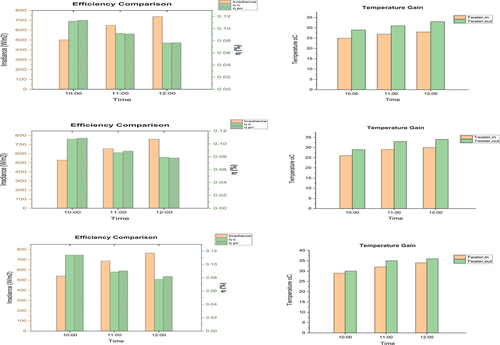
Figure 7b. Efficiency comparison and temperature gain on 28th Feb, and 1st & 2nd March.
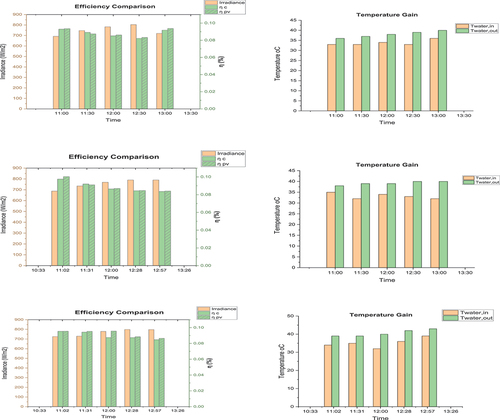
Table 7. Summary of average temperature and efficiency gain with natural circulation.
Table 8. Summary of average temperature and efficiency gain with forced circulation.
Table 9. Comparison with other works done in past on cooling of PV system.