Figures & data
Figure 1. An illustration showing the configuration of a regenerator used in CFD simulations (Chang et al. Citation2013, Citation2016; Gao et al. Citation2009a).
Table 1. Numerical parameters determined in the study.
Table 2. Governing equations and constitutive relations.
Figure 2. Radial distribution of particle volume fraction with time-averaged for four different mesh quantities (y = 250 mm and y = 500 mm, superficial gas velocity = 1 m/s).
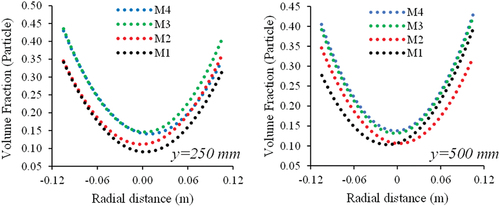
Figure 3. Contours of volume fraction of particles for a) mesh-3 from 0.1s to 5.0s and b) four different meshes at 8 s (steady state) at 1.0 m/s.
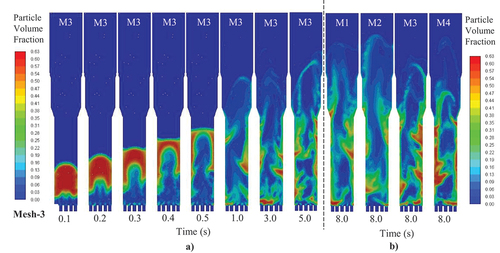
Figure 4. Comparison of axial bed density profiles of a) syamlal-O’Brien, b) gidaspow, and c) schiller-naumann at the early stage of fluidisation (0.1–2.0 s) and steady state (S.S.). (I.D. represent the industrial data).
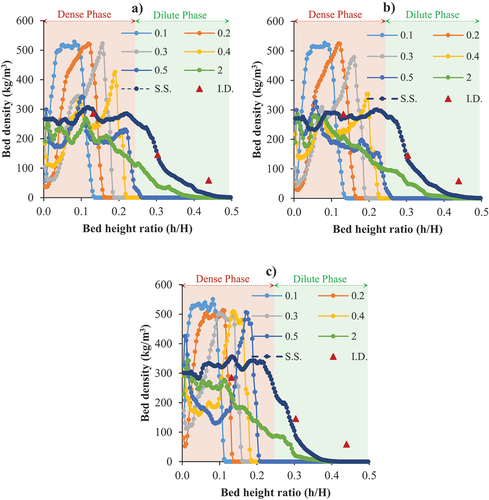
Figure 5. Contours of volume fraction of particles; a) syamlal-O’Brien, b) gidaspow, and c) schiller-nauman drag models at the early stage of fluidisation.
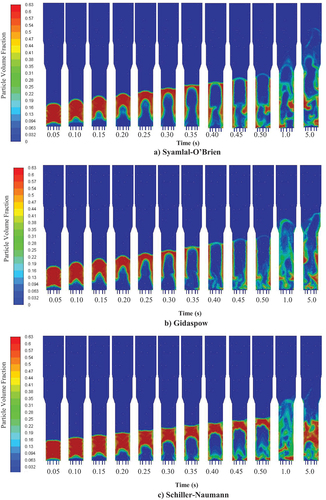
Figure 6. The axial bed density profiles were estimated via a) laminar and b) turbulent flow regimes under geometry-3 and 1.0 m/s of superficial gas velocity at 0.1–0.5 s and steady-state.
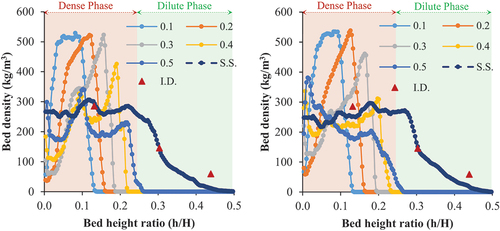
Figure 7. Contours of volume fraction of particles for a) turbulent flow model and b) laminar flow model at the early stage of fluidisation.
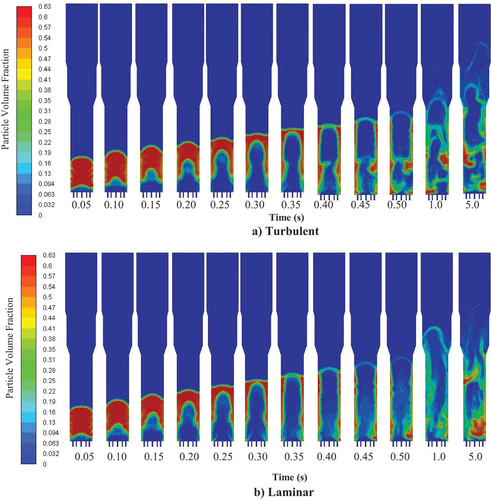
Figure 8. Radial particle volume fraction distribution with time-averaged through different inlet geometries (G1, G2, G3, and G4) at different height positions within the reactor (y = 250 mm, y = 500 mm, and y = 750 mm 0 at 1.0 m/s of superficial gas velocity.
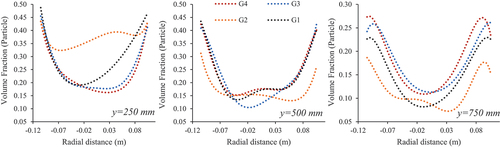
Figure 9. Bed density and contours of volume fraction of particles for a) geometry-1 (G1), b) Geometry-2 (G2), c) Geometry-3 (G3), and d) Geometry-4(G4) at mesh-3 for 10 s.
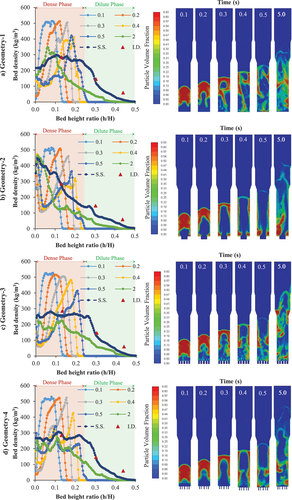
Figure 10. a) The bed density profiles at the early state (0.1s to 2.0s) of the CLC-FCC regenerator operating under 1.0 m/s of superficial velocity and b) The average bed density profiles of various superficial gas velocities (0.6–1.0 m/s) at early state (E.S., average bed density profiles from 0.05 s to 0.5 s) and steady state (S.S., average bed density profiles from 5.0 s to 10.0 s).
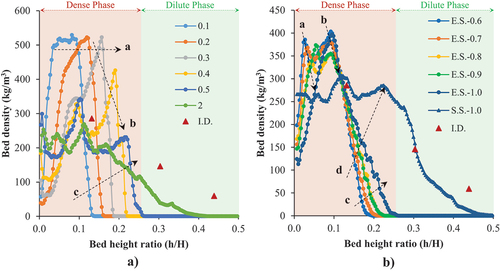
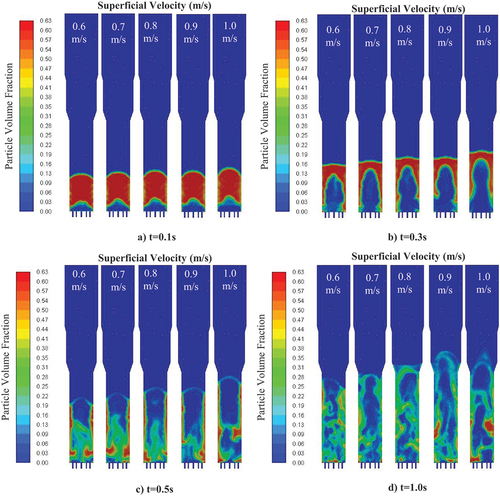
Figure 11. Contours of particles volume fraction at initial stages of the fluidisation; a) 0.1s, b) 0.3s, c) 0.5s, and d) 1.0s.