Figures & data
Figure 1. Data distributions of a) woody biomass feedstocks (137 data) and b) herbaceous and agricultural biomass feedstocks (254 data) with proximate analysis, ultimate analysis, and experimental HHV. “db” represents dry basis.
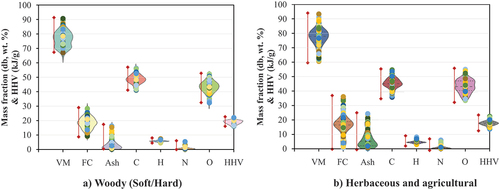
Table 1. Biomass types and categorized collected for the generalizability of the developed equations to predict the HHV.
Table 2. Empirical correlations for the prediction of biomass HHV using UA data.
Table 3. Empirical correlations for the prediction of biomass HHV using combined PA and UA data.
Table 4. Empirical correlations for the prediction of biomass HHV using PA data.
Figure 2. The HHV prediction results of mixed biomass feedstocks (391 data in total) using the empirical correlations based on ultimate analysis data (eqs. (1)-(21)).
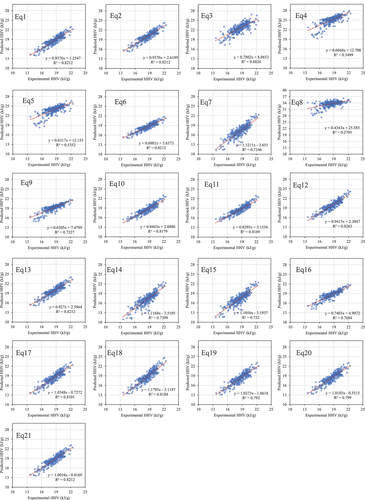
Table 5. Statistical analysis for the prediction of HHV of mixed biomass feedstocks using empirical correlations (eqs. (1)-(21)) based on ultimate analysis.
Table 6. Statistical analysis for the prediction of HHV of mixed biomass feedstocks using empirical correlations (eqs. (22)-(29)) based on both proximate and ultimate analyses.
Table 7. Statistical analysis for the prediction of HHV of mixed biomass feedstocks using empirical correlations (eqs. (30)-(45)) based on proximate analysis.
Table 8. Statistical analysis of the best two empirical correlations for the prediction of HHV of herbaceous and agricultural biomass feedstocks (254 data set) and woody biomass feedstocks (137 data set) using either ultimate analysis or combined ultimate-proximate analyses data.
Figure 3. The HHV prediction results of mixed biomass feedstocks (391 data in total) using the empirical correlations based on combined proximate-ultimate analyses data (eqs. (22)-(29)).
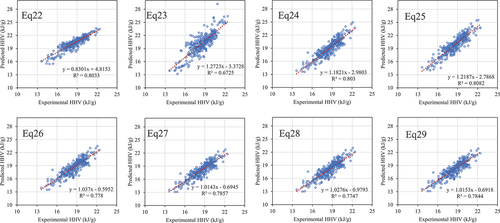
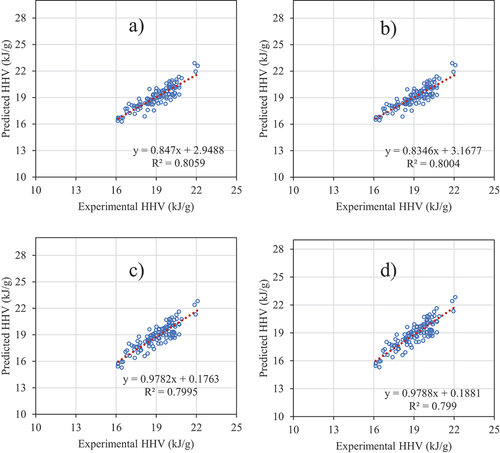
Figure 4. The best four empirical correlations based on average confidence intervals to predict the HHV of mixed biomass feedstocks using proximate analysis data; a)Eq. (32), b) equation (33), c) equation (42), d)Equation (45).
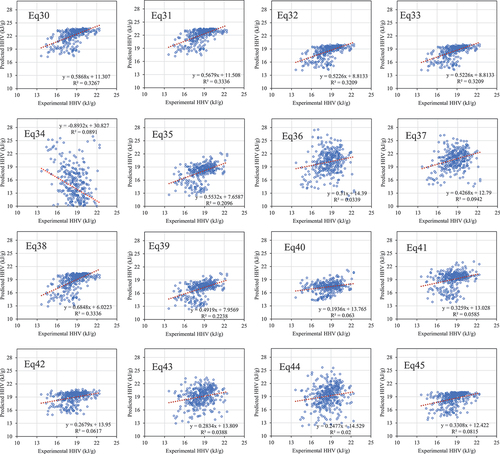
Figure 5. The best two empirical correlations for the prediction of HHV of herbaceous and agricultural biomass feedstocks (254 data set) using ultimate analysis data a) equation (10) and b) equation (11) and combined ultimate-proximate analyses data; c) equation (26) and d) equation (29).
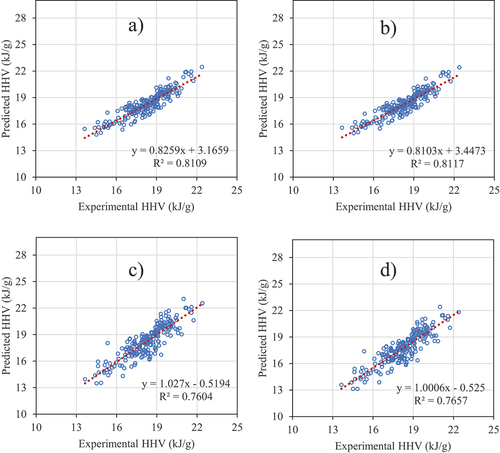
Figure 6. The best two empirical correlations for the prediction of HHV of woody biomass feedstocks (137 data set) using ultimate analysis data a) equation (10) and b) equation (11), and combine ultimate-proximate analyses data; c) equation (26) and d) equation (29).