Figures & data
Table 1. Clinical and demographic characteristics of GSE92874 subjects.
Figure 1. Gene ontology (GO) subnetwork of developmental biological processes. The subnetwork was created using BiNGO functional overrepresentation analysis, and filtering for GO terms with a false discovery rate adjusted p-value (q-value) below .01. The blue colour gradient indicates the significance of the enrichment, with darker colours corresponding to smaller q-values. Node sizes indicate the number of direct interactions (degree) as determined in the original network.
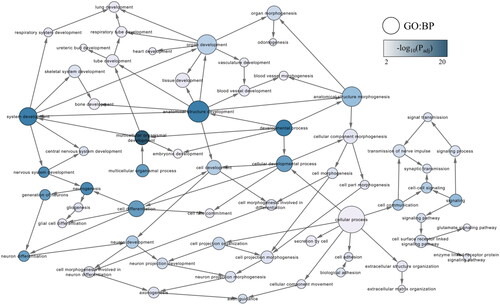
Figure 2. Neuroinflammation and glutamatergic signalling. (www.WikiPathways.org/instance/WP5083) The colours indicate the differential expression of mRNA SCZ vs. healthy control according to the dataset by Narla et al. (Citation2017). Log2 fold change values are reported, with red and blue representing upregulation and downregulation, respectively. Green indicates a false discovery rate adjusted p-value (q-value) < .05.
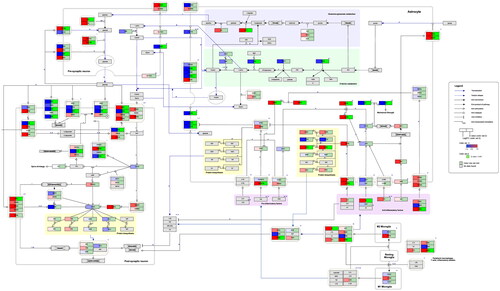
Figure 3. Complement system in neuronal development and plasticity. (http://www.WikiPathways.org/instance/WP5090). The colours indicate the differential expression of mRNA SCZ vs. healthy control according to the dataset by Narla et al. (Citation2017). Log2 fold change values are reported, with red and blue representing upregulation and downregulation, respectively. Green indicates a false discovery rate adjusted p-value (q-value) < .05.
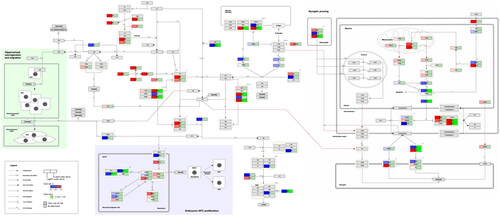
Figure 4. Network of interactions between FDA approved drugs and their targets in the combined neuroinflammation and complement system network. (A) Interactions derived from WikiPathways:WP5083 network. (B) Interactions derived from WikiPathways:WP5090 network. Log2 fold change values of the genes (ellipse) are represented by a colour gradient, with red and blue indicating upregulation and downregulation, respectively. DEGs are signified by a white label and black border. FDA approved drugs (grey diamonds) targeting the genes are categorised into antipsychotics (green), immunosuppressants (red), anaesthetics (purple), CNS depressants (grey), anticonvulsants (yellow) and antiplatelet (orange).
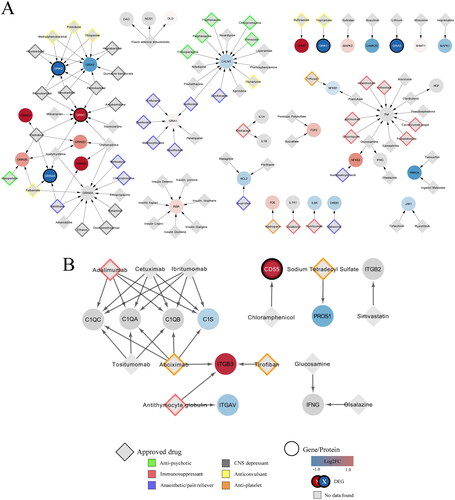
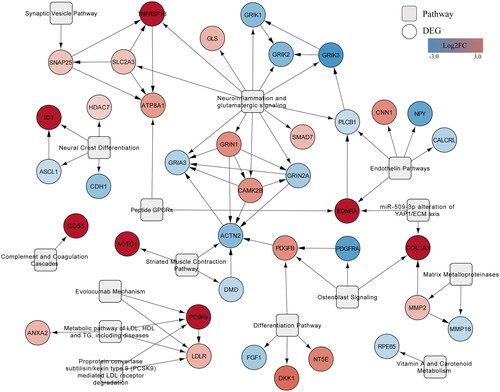
Figure 5. Network of interactions between DEGs and the 15 most significantly enriched WikiPathways pathways. Pathways (rounded rectangles) with the highest pathway statistics-determined Z-scores and their first neighbour DEGs that were upregulated (red) or downregulated (blue).