Figures & data
Table 1. CNV pathways created in this study and presentation of schizophrenia risk genes from different sources in those pathways by number and enrichment score (z-score).
Figure 1. 1q21.1. Copy number variation pathway WP4905. The red arrow indicates the position of the deleted genes on the chromosome. Protein coding gene are black boxes, pseudogenes grey, RNA genes purple, metabolites blue and pathways green. The interactions are annotated interactions carrying the information about the nature of interaction for automated analysis. The small numbers indicate the literature references http://www.wikipathways.org/instance/WP4905.
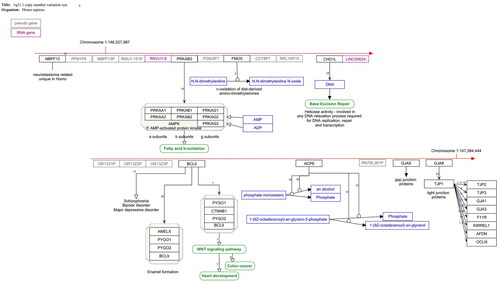
Table 2. Shared pathways between the different CNVs and their z-scores from schizophrenia risk gene overrepresentation analysis.
Figure 2. Pathway overlap between the different CNVs. (a) The nine CNV pathways (violet octagons with red borders) (except 15q11.2) share genes (green spheres) with a group of pathways (violet octagons, list in ) that are known to play a role in schizophrenia development. (b) BDNF pathway shares genes (red border) with each of the investigated CNV pathways.
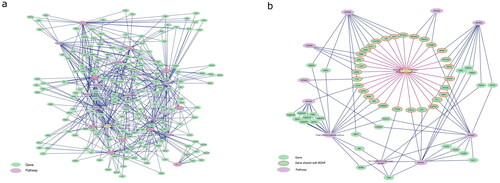
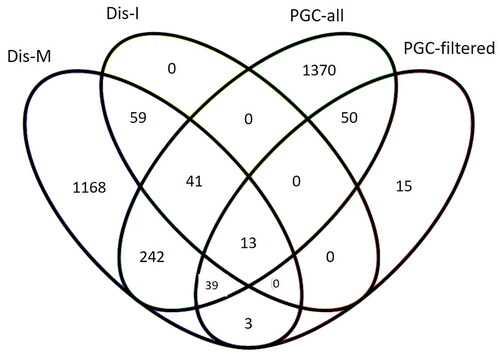
Figure 3. Overlap in schizophrenia risk genes extracted from GWAS studies and DisGeNET database. PGC-all and PGC-filtered (Trubetskoy et al. Citation2022), Dis-I = intersection/overlap between DisGeNET’s gene-disease and variant-disease associated genes for schizophrenia, Dis-M = merge of DisGeNET’s gene-disease and variant-disease associated genes for schizophrenia.