
Figures & data
Figure 1. Schematics of the pipe facility with Node’s IDs circled and with pressure transducers’ IDs squared out. Check for the Node’s elevations across different configurations.
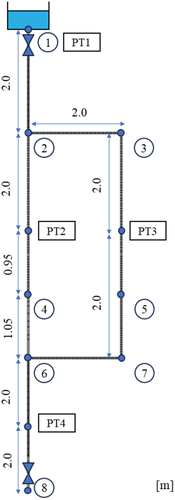
Table 1. Pipe elevation of each node and high point position for each configuration, with the high point centred in the shaded node.
Figure 2. Experimental pressure-head signals for C1 for (a) d = 2.2 and (b) d = 21 mm, and for C2 for (c) d = 2.2 mm and (d) d = 21 mm.
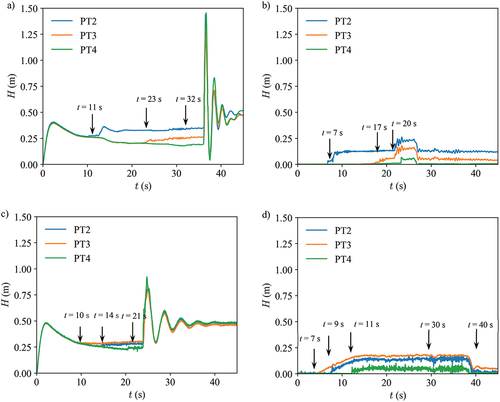
Figure 3. Image treatment example of air pocket volume for configuration C1 and d = 3.0 mm: (a) Original image, (b) Cropped image, (c) Image after edge detection and binarized and (d) Smoothed out image to reduce image noise.
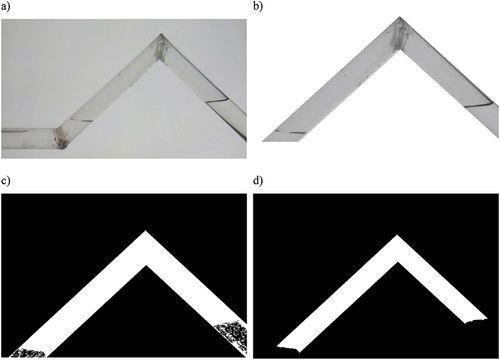
Figure 4. Experimental air pocket volumes for each configuration (C1 - C6), including the data from all repetitions.
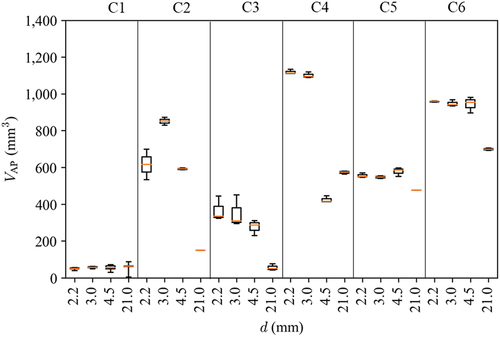
Figure 5. Experimental and predicted pressure-head signals in pressure transducers PT2, PT3 and PT4 for C1 with downstream orifice with d = 2.2 mm, and d = 21 mm and for C2 with downstream orifice with d = 2.2 mm, and d = 21 mm.
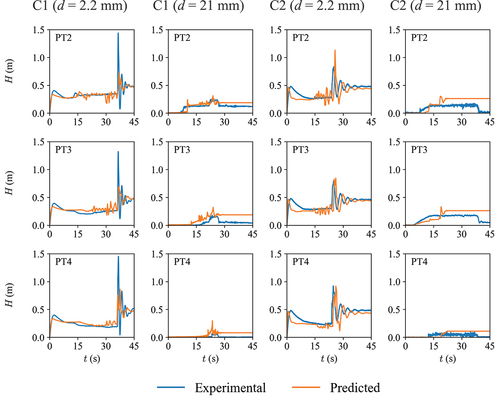
Figure 6. Snapshots of the predicted pipe filling process in Configuration C1 with d = 2.2 mm at different filling times and the final steady state when air pocket is fully formed.
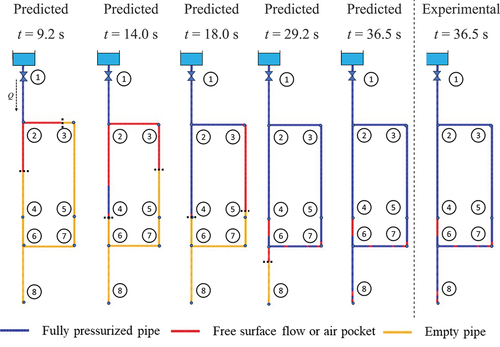
Figure 7. Snapshots of the predicted pipe filling process in Configuration C2 with d = 2.2 mm at different pipe filling times and the final steady state experimental air pocket location.
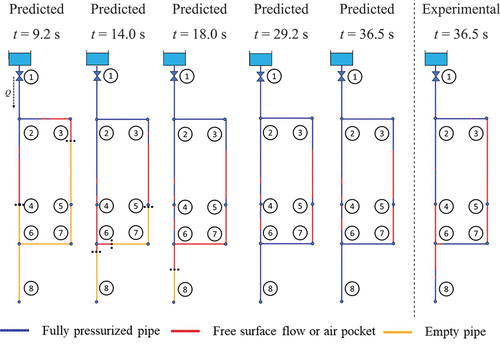
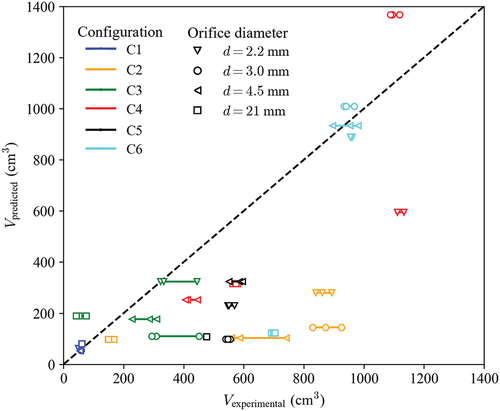
Figure 8. Comparison between experimental and predicted air pocket volumes.
Data availability statement
The data that support the findings of this study are available from the corresponding author, J. Ferreira, upon reasonable request.