
Figures & data
Table 1. Data collection.
Figure 1. The time-varying autoregressive effect of motivation (left) and the cross-lagged effect of recovery (right) of Player 2.
Note: The solid line shows the strength of the effect over time, whereas the dashed lines correspond to the 95% Bayesian Credible Intervals (i.e., the uncertainty of the smooth function). The horizontal line serves as guidance for an effect of 0. t–1 represents the previous point in time and t the current point in time.
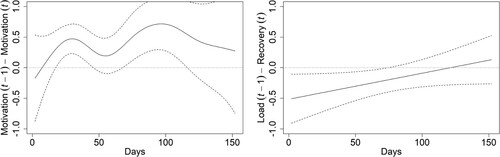
Figure 2. Network graph of Player 1.
Note. The network remained stable across the season (i.e., no changes in effects). The green/solid edges represent positive effects and the thickness reflects the absolute value of the parameter estimate, that is, the magnitude of the effect (thicker edges display stronger effects and thinner edges display weaker effects). The self-loops show the autoregressive effects and the direct edges represent cross-lagged effects. We used NodeXL (https://nodexl.com/) with the Furchterman-Reingold layout to visualise the graphs.
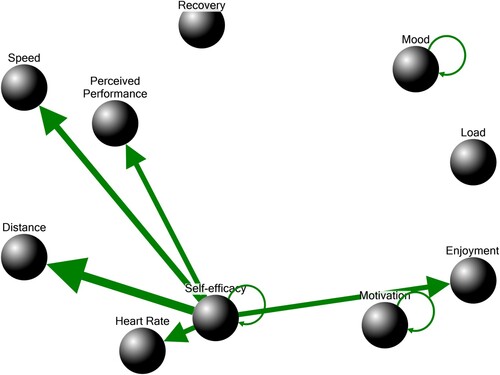
Figure 3. Network graph of Player 2.
Note. The network changed across the season. The green/solid edges represent positive effects, the red/dashed edges represent negative effects and the thickness reflects the absolute value of the parameter estimate, that is, the magnitude of the effect (thicker edges display stronger effects and thinner edges display weaker effects). The self-loops show the autoregressive effects and the direct edges represent cross-lagged effects. Changing effects (cf. ) are highlighted by a yellow/glowing shade around the edges. We used NodeXL (https://nodexl.com/) with the Furchterman-Reingold layout to visualise the graphs.
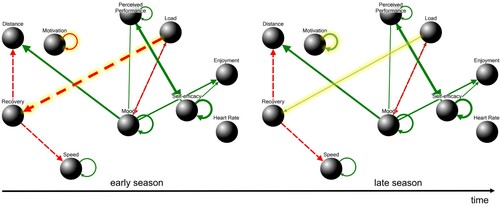
Table A1. BIC Scores of the Time-Invariant and Time-Varying Models of Player 1.
Table A2. BIC Scores of the Time-Invariant and Time-Varying Models of Player 2.
Table A3. Significant Time-Invariant Parameters of Player 1
Table A4. Significant Time-Invariant Parameters of Player 2.
Table A5. Significant Time-Varying Parameters of Player 2.
Data availability statement
The R code has been made publicly available at DataVerseNL and can be accessed at https://dataverse.nl/privateurl.xhtml?token = eaf92882-1755-42df-86f5-d430f45b9dad [https://dataverse.nl/dataset.xhtml?persistentId=doi:10.34894/HNA8QQ]. The data contains sensitive information about the subjects and is therefore restricted from openly sharing it. Requests can be made by researchers affiliated with universities or independent, non-commercial research institutes via the same repository.