Figures & data

Figure 1. Spatial distribution of the SST trend in the global region during 1950–2005 (shading; units: °C yr−1): (a) ERSST.v5 dataset (purple contour is the area that passes the 95% confidence test of the warming trend); (b) averaged values of the top five CMIP5 models; (c) averaged values of the top five CMIP6 models; (d) composite of all CMIP6 models. The SNR (2) of the trend is indicated by the green contour for the ratio of the mean value of the trend to the standard deviation of all 37 models. The spatial correlation coefficients and RMSEs between (a) and (b–d) are respectively marked in the lower-left corner of each panel. The IO basin is indicated by the blue box (35°S–25°N, 33°–113°E)
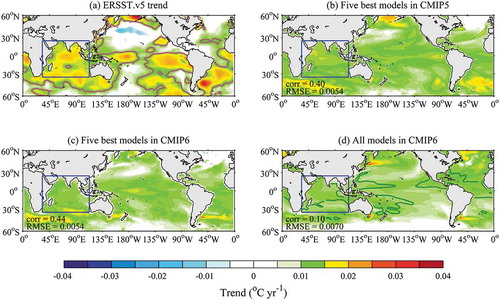
Figure 2. (a) Spatially averaged warming trend in the IO region of the ERSST.v5 dataset and each CMIP5 model. (b) As in (a) but for CMIP6 models. (c) Difference between the spatially averaged warming trend in the IO region and other ocean regions of the ERSST.v5 dataset and the CMIP5 models. (d) As in (c) but for CMIP6 models. All trends have units of °C yr−1. The warming period selected is 1950–2005
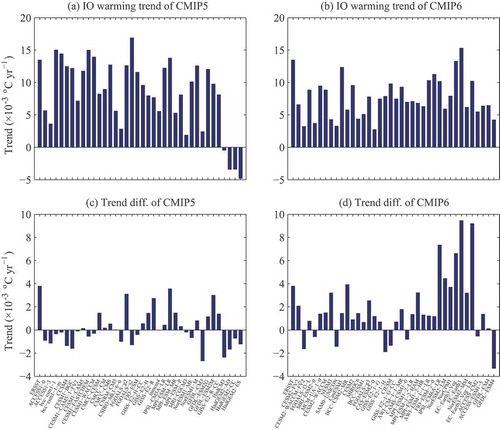
Figure 3. (a) Globally averaged RMSEs of simulated warming trend relative to the observed value for each CMIP5 model. (b) As in (a) but for CMIP6 models. (c) Averaged RMSEs of simulated IO warming trend compared with observed value for each CMIP5 model. (d) As in (c) but for CMIP6 models. (e) Globally averaged correlation coefficients of the observed warming trend and the simulated value in each CMIP5 model. (f) As in (e) but for CMIP6 models. (g) Averaged correlation coefficients of the observed IO warming trend and the simulated value in each CMIP5 model. (h) As in (g) but for CMIP6 models. The units in (a–d) are °C yr−1. The observed values are calculated based on the ERSST.v5 dataset. The period selected is 1950–2005
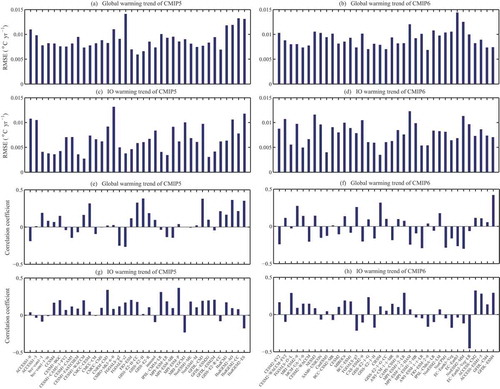
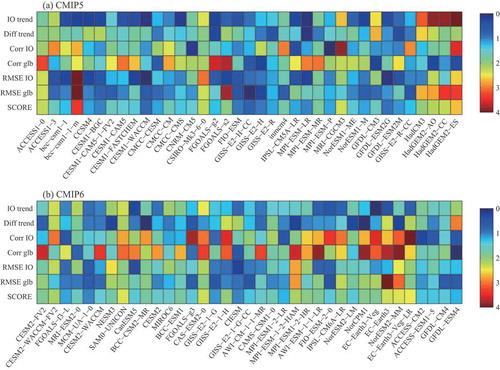
Figure 4. Simulation performance metrics for each model of (a) CMIP5 and (b) CMIP6. Six primary metrics are used to depict the significant warming in the IO region: IO trend (the warming trend in the IO region); Diff trend (the difference between the warming trends of the IO and other ocean regions); Corr IO (the correlation coefficients simulated by each model against the observed SST trend in the IO); Corr glb (the correlation coefficients simulated by each model against the observed SST trend in the global ocean); RMSE IO (the RMSEs simulated by each model against the observed SST trend in the IO); and RMSE glb (the RMSEs simulated by each model against the observed SST trend in the global ocean). The warming score is defined as the average of these six metrics