Figures & data
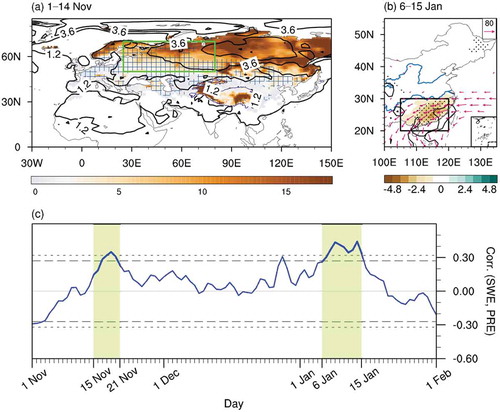
Figure 1. (a) Interannual variation of SWE (shaded; units: mm) and SAT (contours; units: °C) during 1–14 November 1979–2016. The region gridded in blue denotes that the correlation coefficients of SWE and SAT during 1–14 November (14-day mean) exceed the 99% confidence level, which represents the land–atmosphere coupling. (b) Temporal evolution of Urals SWE index during 1–14 November 1979–2016. Blue and red stars mark the years with decreased and increased Urals SWE, respectively. The green rectangular box in (a) denotes the Urals region used to define the Urals SWE index in (b)
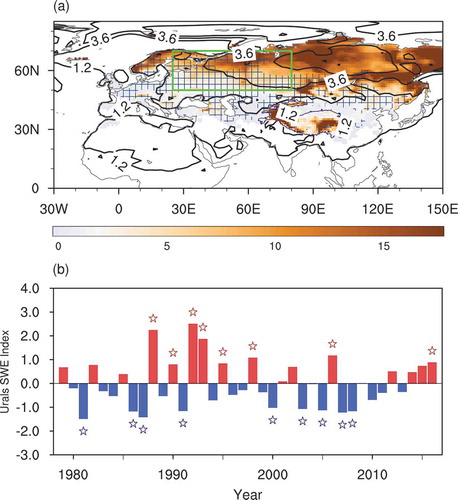
Figure 2. Top: Composite difference of 7-day running-mean daily precipitation (units: mm d−1) averaged over 105°–120°E from 1 November to 1 February between decreased and increased Urals SWE years. Crossed regions denote values exceeding the 95% confidence level. Bottom: Correlation coefficients of Urals SWE index during 1–14 November with 7-day running-mean daily precipitation index in southern China (20°–30°N, 105°–120°E; denoted by the rectangular box in ). Dashed and dotted lines represent the correlation coefficients at the 90% and 95% confidence level, respectively
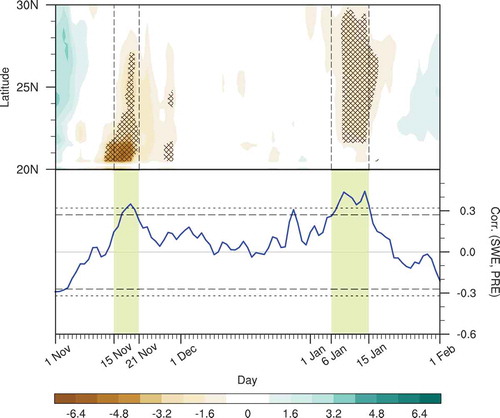
Figure 3. (a–d) Composite difference of vertically integrated water vapor transport (from the surface to 300 hPa; vectors; units: kg m−1 s−1), SWE (shaded; units: mm), and SAT (contours; units: °C) during (a) 1–14 November, (b) 15–21 November, (c) 22 November to 5 January, and (d) 6–15 January, between decreased and increased Urals SWE years. The contour interval is 2.5°C, with negative values in dashed contours. Regions gridded blue represent land–atmosphere coupling, calculated as the correlation coefficients between SWE and SAT averaged in each period. (e–h) Composite difference of 300-hPa meridional wind (shaded; units: m s−1), geopotential height (contours; units: 10 gpm), and WAFs (vectors; units: m2 s−2). Thick brown curves denote climatological westerly jet axes at 300 hPa. Dotted regions denote values exceeding the 95% confidence level
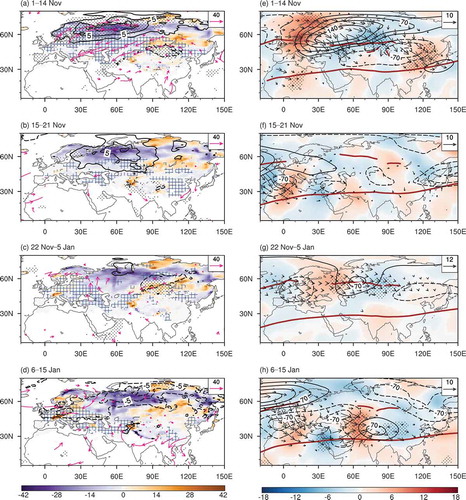
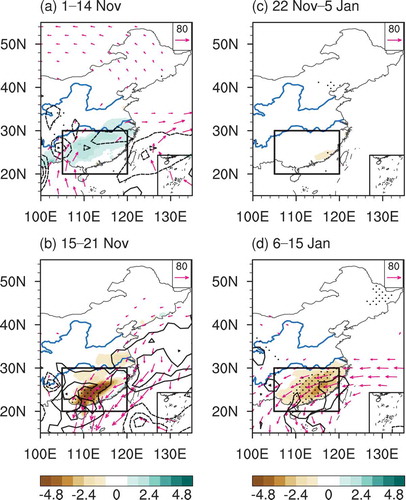
Figure 4. Composite difference of precipitation (shaded; units: mm d−1), vertically integrated water vapor transport (from the surface to 300 hPa; vectors; units: kg m−1 s−1), and its divergence (contours; units: 10−6 kg m−2 s−1) during (a) 1–14 November, (b) 15–21 November, (c) 22 November to 5 January, and (d) 6–15 January, between decreased and increased Urals SWE years. The contour interval is 25 × 10−6 kg m−2 s−1, with negative values as dashed contours. The blue curves denote the Yangtze River and Yellow River, respectively. The region marked by the rectangular box denotes southern China. Dotted regions denote values exceeding the 95% confidence level