Figures & data
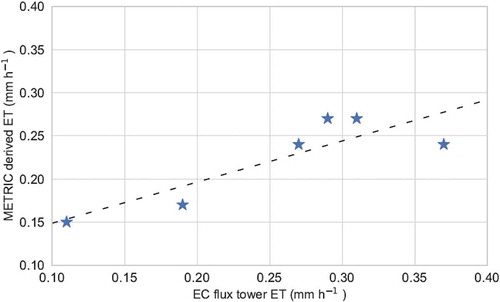
Figure 1. Study area with the locations of the EC stations considered for our ET calculations. The color map shows the elevation distribution. We considered a region extending fully from north to south across the whole of Nepal so that the full extent of the possible elevation distribution would be included
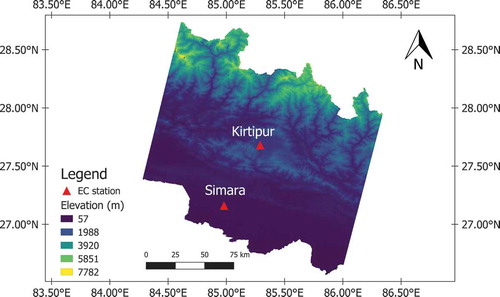
Table 1. Paths, rows, and dates of satellite overpass of Landsat-8 for our study area. Two Landsat-8 tiles cover the whole study area that we considered. We considered six different days to capture possible seasonal variations in our analysis
Table 2. Locations of the EC flux tower site measurements of the two different stations
Table 3. METRIC-derived intermediate products for the months of March, April, May, June, October, and November 2016
Figure 2. METRIC-derived ET at the time of satellite overpass for 15 March 2016 (upper left), 16 April 2016 (upper right), 18 May 2016 (middle left), 3 June 2016 (middle right), 25 October 2016 (lower left), and 10 November 2016 (lower right)
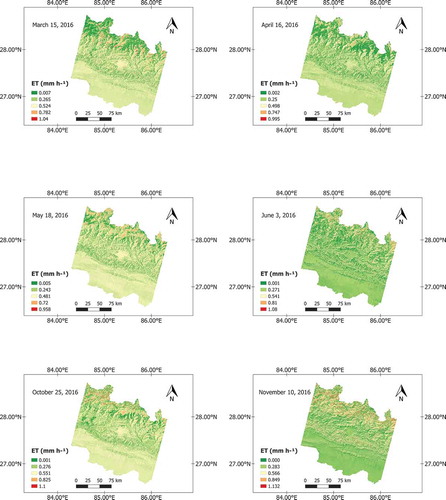
Figure 3. ET estimated from the METRIC model in comparison to the ET from the flux tower from Simara across different months
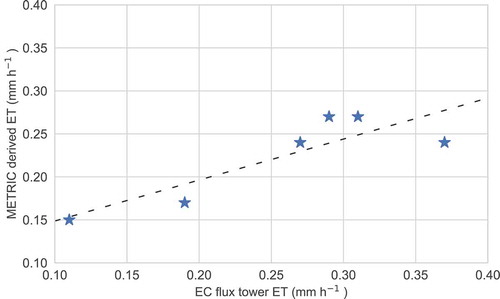
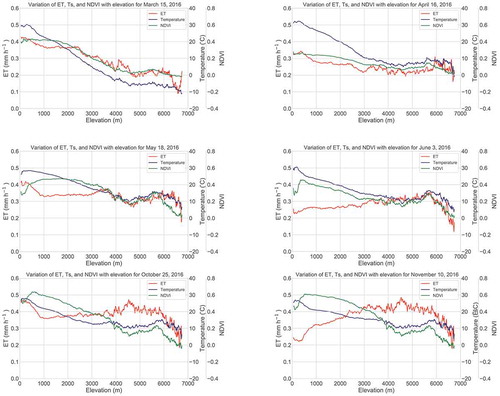
Figure 4. Variation of ET, Ts, and NDVI with elevation for 15 March 2016 (upper left), 16 April 2016 (upper right), 18 May 2016 (middle left), 3 June 2016 (middle right), 25 October 2016 (lower left), and 10 November 2016 (lower right)